Download
1 / 29
290 likes | 459 Vues
Indoor Air Quality in Museums and Historic Properties 6th INTERNATIONAL CONFERENCE 10-12 November 2004 CNR-Padova. In Situ Damage Assessment of Microclimates for Cultural Heritage Preservation. Marianne Odlyha Thermal Methods & Conservation Science

E N D
Indoor Air Quality in Museumsand Historic Properties • 6th INTERNATIONAL CONFERENCE • 10-12 November 2004CNR-Padova In Situ Damage Assessment of Microclimates for Cultural Heritage Preservation Marianne Odlyha Thermal Methods & Conservation Science Birkbeck College, University of London
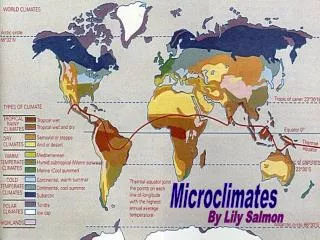
Topic : Innovative and existing tools to monitor the environment in museums (or microclimate of art objects) and the damage on art objects. Microclimate Indoor Monitoring in Cultural Heritage Preservation MIMIC http://iaq.dk/mimic
Microclimate Indoor Monitoring in Cultural Heritage Preservation MIMIC (EVK4-2000-00040) EC 5th framework : Subsection 4.2.1 Improved damage assessment of cultural heritage Alcázar Segovia Cord room National Museum Denmark Room 134 EC Scientific Officer responsible: Dr.Johanna Leissner
Innovative toolbased on piezoelectric quartz crystal technology exposed in Charlottenborg Castle, Copenhagen
QTS-3 22cmx14cm 7cm x 5cm
Design of QTS-3 system Incorporates reference crystal (uncoated) so that the output signal is a frequency difference and gives the actual coating frequency or loading on the crystal. This will be referred to as F (kHz) Measured damage is then calculated from the change in the value of F (kHz) referred to as f (Hz) and expressed as a ratio (f/F) ie changein Hz perkHz of coating.
1. Example of data 2. Example of processed data: calculate f (change in frequency) / F (frequency at time =0secs). F is the loading on the crystal Petrie Museum, London Coated crystals Uncoated crystal Days
End-users English Heritage Rangers after E1 (10.03.04-10.05.04) 61 days f/F(RM) =16 c.f Chiswick RM(f/F) =25
Exposure in British Library 17.02.04 to 5.10.04 Crystal posn Days f/F
Processing ofClimate data Climate data from selected sites (Southern Europe), & (Northern Europe) have been compiled in one large climate data file: Grand Unified MIMIC Data Base “GUMD”. GUMD, and related data, are all available on the MIMIC website. http://iaq.dk/mimic. For data reduction we record the number of times T & RH values exceed certain limits as a preparation for calculating risk factors. Light dosage (luxh) is calculated for each exposure period. Pollution dosage is also calculated (g/m3h).
Processing of climate data (National Museum of Denmark) & pollutant levels NMD Room 134 PQC array Start date End date No. Days 24/07/2002 02/09/2002 40 T_av T_max T_min 26.8 22.1 30.2 T variations T variations T variations T variations T variations 0,0-2,0C 2,1-4,0C 4,1-6,0C 6,1-8,0C >8,0C 9 30 1 0 0 RH_av RH_max RH_min 49.5 62.4 32.0 RH variations RH variations RH variations RH variations RH variations RH variations 0,0-5,0% 5,1-10,0% 10,1-15,0% 15,1-20,0% 20,1-25,0% >25,0% 5 18 12 3 0 2 TWPI Lightdose (kluxhrs) 19 22.1 Dose SO2 Dose O3 Dose NO2 Dose NOx Dose HNO2 Dose HNO3 736.8 4281.6 13473.6 28492.8 7490.4 3055.2
Response PQC (f/F) vs no. of exposures Passive sampler dosimeters interrogated at monthly intervals RM response NMD134 NMD after 2 exposures in Rm 134 (July - Sept 2002) E1= 30 days E2= 40 days Ecum=70 days Vestibule Response (f/F) resin mastic coated crystals in positions 2, 4and 7 NMD134 Includes one exposure in Vestibule
Processing of climate data (National Museum of Denmark) & pollutant levels NMD Vestibule PQC array Start date End date No. Days 2/07/2002 12/08/2002 40 T_av T_max T_min 27.2 23.7 31.4 T variations T variations T variations T variations T variations 0,0-2,0C 2,1-4,0C 4,1-6,0C 6,1-8,0C >8,0C 9 29 2 0 0 RH_av RH_max RH_min 42.8 57.1 25.5 RH variations RH variations RH variations RH variations RH variations RH variations 0,0-5,0% 5,1-10,0% 10,1-15,0% 15,1-20,0% 20,1-25,0% >25,0% 1 20 17 2 0 0 TWPI Lightdose (kluxhrs) 22 4303700 Dose SO2 Dose O3 Dose NO2 Dose NOx Dose HNO2 Dose HNO3 768 12192 21984 24288 1632 7872
Thermokinetics (Advanced kinetic calculations) Effect of temperature modulations of sample maintained at 40 (+/- 40C) for 1 year http://www.akts.com
Compare light and pollutant dosages received in NMD (134) and NMD Vestibule much higher light dosage higher ozone dosage lower NO2 higher HNO3 and much higher f/F
Calibration: Effect of long exposure (14hrs at 10ppm) NO2onresin mastic coated crystals positions 2,3 and 4 exposed (f/F) vs hrs of exposure Gas off Gas on Exposure 10ppm 12 hrs gives same response as 20ppm for 6 hrs
Calibration (f/F) vs Dosage (ppm hrs) NO2 ppm hrs Petrie 29.7 ppm hrs (1month) NMD V 11.57 ppm hrs(1month)
Calibration : Modulated RH (50%70% 50% 30% 50% ) imposed on resin mastic coated crystal exposed to NO2
Site information from FTIR data: example of strip frame data for egg tempera strips exposed at Osterley Manor Similar table with exposures for the same period but giving f/F values for the sites
FTIR Multiple external reflectance with the Dura AmplirIR
FTIR Mastic Blue=Isle of Wight(direct sunlight 12 hrs) Red=Chiswick (70 days, f/F= 25) Purple=040304 Control, Black=British Library (after 189 days, f/F = 8.8)
Climate data reduction expressed in terms of TWPI values for the duration of dosimeter exposure. 14C, 40%RH = 124 Years 20C, 50%RH = 44 Years (heat for human comfort lowers TWPI) 28C, 70%RH = 10 Years In MIMIC British Library most controlled site and for periods of dosimeter exposure Damage values are registered by coatings are low. Indoor pollutant levels are also lowest of the sites. TWPI values are low (c.30-40) MIMIC dosimeters together with TWPI values describe more realistically the quality of the environment. Conclusions
Conclusions Summer NMD 134 June 2002 TWPI 27 ALC MM 45 ALC Cord 54 NMD 134 July 2002 TWPI 19 ALC MM 36 ALC Cord 34 TWPI decreases, dosimeter damage values increase (pollutants ALC MM increase in O3 , NMD increase in NOx) Winter SAC Oct-Nov 2002 TWPI 50 SAC Jan-Feb 2003 TWPI 91 TWPI increases, dosimeter damage increases, and pollutant dosage NOx increases Charlottenborg Castle (TWPI 97) has lower level of pollutant dosage NOx and lower level of dosimeter damage.
Benefits MIMIC project Small portable system which can be exposed for 1-3months either as passive sampler or continuously recording. It will incorporate RH,T sensor. Option of telemetry link will be possible. Optional small palette with similar coating (egg tempera, varnish). Readily analysed by FTIR. Possible use for screening damage during transport of works of art (Meeting organised by SIT,Madrid,Nov 2003) Database of damage values obtained at monitored sites (delta f/F) and chemical data (FTIR) . Database of damage values obtained from accelerated ageing. .
Acknowledgements EC 5th Framework DGXII “Protection & Conservation of European Cultural Heritage””.for funding the MIMIC project Nancy Wade, paintings conservator University of London , Birkbeck College, Dr.J.Slater Dr. M.Appleton (QuartzTec) Dr.Q.Wang,R.Campana, Dr. A.Beard, and C.F.Wilson University College, Dr.K.Pratt (UCL Chem) CNR- Istituto Inquinamento Atmosferico & IROE-CNR, Dr.F. de Santis, Dr.M.Bacci, Dr.M.Picollo, CNR-Rome and Florence,Italy El Alcázar,Segovia,Spain, Victoria Smith. National Trust, U.K., Linda Bullock , National Museum of Denmark, Copenhagen, Morten Ryhl-Svendsen, Dr.Tim Padfield, and Lars Aasbjerg Jensen FOM Institute (Netherlands) Prof. J.J.Boon & Dr. E.Ferraira Tate Britain Conservation Dept.,Dr.B.Ormsby,Stephen Hackney & Dr.J.H.Townsend Winnats Scientific ServicesDr.R.West, XPS analysis English Heritage David Thickett British Library K.Matsuoka
Compare light and pollutant dosages received in NMD (134) and NMD Vestibule much higher light dosage Higher ozone dosage Lower NO2 Higher HNO3 And much higher f/F