Download
1 / 32
320 likes | 415 Vues
Discussing endogenous business cycles, dynamics of reconstruction, and economic consequences of extreme events in economic models. Analyzing NEDyM, endogenous dynamics, and the economic consequences of extreme events.

E N D
Non-equilibrium dynamic models and impacts Patrice Dumas (CIRED,CIRAD) Stéphane Hallegatte (World Bank) Michael Ghil (ENS, Paris, & UCLA) Workshop on Coupled Climate-Economics Modelling and Data Analysis 22 - 23 November 2012 ENS, Paris
Outline Endogenous business cycles Dynamics of reconstruction and extreme events economic consequences
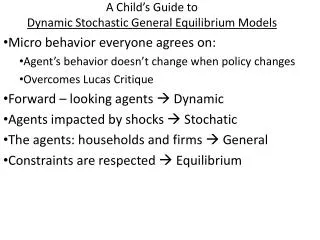
A tale of two theories: the "real" cycle and the endogenous cycle theories In the real cycle theory, fluctuations from exogenous "real" (i.e. not monetary) shocks (changes in productivity or in energy prices, fiscal shock). Aside from exogenous shocks, the economic system is stable: • all markets are at equilibrium, no involuntary unemployment • Deviation from equilibrium are damped more or less rapidly • Acting on the economy (recovery policy), is not usefull In endogenous business cycle (EBC) models, cyclical behavior originates from endogenous instabilities in the economic system Several instabilities have been proposed: · profitability-investment instability · delays in investment · income distribution Acting on the economy can have positive effects, stabilizing it or shifting its mean state.
NEDyM (Non-equilibrium Dynamic Model) Represents an economy with one producer, one consumer, one goods that is used both to consume and invest. Based on the Solow (1956) model, in which all equilibrium constraints are replaced by dynamic relationships that involve adjustment delays. The NEDyM equilibrium is neo-classical and identical to that in the original Solow model. If the parameters are changing slowly, NEDyM has the same trajectories as the Solow model. Because of market adjustment delays, NEDyM model dynamics exhibits Keynesian features, with transient trajectory segments, in response to shocks. NEDyM possesses endogenous business cycles! Hallegatte, Ghil, Dumas & Hourcade (J. Econ. Behavior & Org., 2008)
Hopf bifurcation: from stable equilibrium, to limit cycle, to chaotic behavior
inv = 2.5 transition to chaos (irregular behavior) inv = 1.7 (purely periodic)
inv = 20 very asymmetric business cycle (relaxation oscillation) inv = 10 irregular orbit (kinky torus)
Endogenous dynamics: an alternative explanation for business cycles
Interpretation of the instability Business cycles originate from the profit-investment relationship (oscillations with a 5.5-year period) higher profits > more investment > larger demand > higher profits Business cycles are limited in amplitude by three processes: Increase in labor costs when employment is high Constraints in production and the consequent inflation in goods prices when demand increases too rapidly Financial constraints on investment
Main flaw in the model business cycle: the amplitude of price oscillations
Correction: accounting for quantities in behavioral equations
Calibration of NEDyM Need to calibrate the endogenous business cycle Kalman filter shows good result on « identical twins » experiments But much harder on real data => start from a representative cycle?
Economic consequences of extreme events Economic consequences of extreme events
Direct vs indirect losses Direct losses: • Casualties and injuries • Direct economic losses (i.e., value of what has been destroyed or damaged) Indirect losses: • (1) Business interruption, supply-chain disruption, and propagations • (2) Lost production during reconstruction • (3) Demand surge and increased reconstruction costs • (4) A macro-economic feedback? • (5) Long-term consequences on economic growth Other costs: • Emergency costs (Katrina: $8 billion) • Political destabilization • Psychological trauma and social network disruption • Long-term impact on specific sectors (e.g., tourism)
Business interruption and propagation data from the Northridge earthquake in 1994Business interruption and propagation data from the Northridge earthquake in 1994 Data on the Northridge earthquake From Tierney (1997) Survey by the Disaster Research Center, at the University of Delaware. Conducted with a representative, randomly-selected sample of businesses (1100) in the cities of Los Angeles and Santa Monica, two jurisdictions that were particularly hard-hit by the earthquake Businesses with no damages had to close because of propagations, making the total cost larger.
Demand surge and reconstruction costs from the 2004 and 2005 hurricane seasons Definition: “a temporary increase in repair costs above the standard level of costs due to the lack of qualified workers or materials” Data from XActimate and Risk Management Solutions
A macroeconomic feedback ? Supported by (rough) data on demand surge The demand surge remained limited after Andrew (20%). This might be explained by the pre-existing economic situation:
How to model extreme events consequences? Natural disasters are a series of shocks that destroy capital, leading to a disequilibrium Preexisting disequilibrium may be important Using a classical production function is problematic as there are no decreasing returns on capital hit by a disaster Accounting for financial and technical constraints on the reconstruction pace is necessary to reproduce the observed response to past disasters over the short term
Extreme event economic consequences modelling From Hallegatte et al. (2007, Ecological Economics) From Hallegatte et al. (2007, Ecological Economics) The total cost of an event depends on the reconstruction capacity of the economy.
Interaction between intrinsic dynamics and shocks (1) From Hallegatte and Ghil (2007)
Interaction between intrinsic dynamics and shocks (2) Limited losses if the disaster affects an economy in recession From Hallegatte and Ghil (2007)
Interaction between intrinsic dynamics and shocks (3) Large losses if the disaster affects an economy in expansion A vulnerability paradox: growing economies are more vulnerable ! From Hallegatte and Ghil (2007)
Consequences of extreme events Here also, the average loss depends on the event characteristics and on reconstruction capacity
Natural disasters and bifurcation in losses Index of disaster frequency and intensity Index of reconstruction capacity The impact of a series of events is not the sum of the event impacts.
Positive feedbacks and poverty traps Limited reconstruction capacity Long reconstruction period after each disaster « Positive » feedback Limited economic development Possibility of poverty trap Large cost of natural disasters Impossibility to increase the infrastructure and capital stocks Disasters can be a significant obstacle to economic growth and development
Reconstruction and endogenous technical change Accounting for endogenous technical change changes the consequences of disasters: If reconstruction uses the best available technologies (EN), endogenous technical change reduces the negative consequences of disasters. But if reconstruction only replace the capital, using identical technologies (IM), then endogenous technical change amplifies the negative consequences of disasters
Technical change and a series of disasters If reconstruction uses the best available technologies (EN), the mean GDP losses due to a series of disasters are cancelled out. Otherwise (identical reconstruction, IM), mean GDP losses are increased.
Indirect costs in an input output approach Production changes in 15 sectors in Louisiana, in the Katrina’s aftermath, using the ARIO (Adaptive Regional Input-Output) Model. Boom in the construction sector An input-output model of the local economy, with 15 sectors that interact with each other. We investigate the interplay of: • the decrease in production capacity due to damages; • the increase in demand due to reconstruction needs Decrease in production capacity Direct losses: $107b Total losses: $135b
Nonlinear relationship between direct and indirect costs The boom in the reconstruction sector is limited by economic and technical constraints, and by damages, leading to a nonlinearity. In Louisiana, this nonlinearity appears when direct losses exceed $50 billion.
Sectoral results Underestimation in sectors with small businesses Employment losses per sector, data and model
Conclusion Non equilibrium economic model allows to represent some stylised facts on business cycles, but there is a need for calibration Constraints on reconstruction leads to realistic dynamics Smaller scales allow to understand the constraints