Download

1 / 53
540 likes | 961 Vues
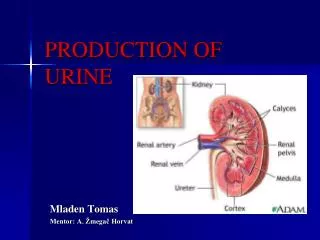
Course 1 Unit 2. The characteristics of urine, faeces and greywater. Teacher Mariska Ronteltap m.ronteltap@unesco-ihe.org. Course 1 Unit 2. Course 1 Unit 2 The characteristics of urine, faeces and greywater. Content : Brief introduction Part A: Characteristics of urine

E N D
Course 1 Unit 2 The characteristics ofurine, faeces and greywater Teacher Mariska Ronteltap m.ronteltap@unesco-ihe.org
Course 1 Unit 2 Course 1 Unit 2The characteristics of urine, faeces and greywater • Content: • Brief introduction • Part A: Characteristics of urine • Part B: Characteristics of faeces • Part C: Characteristics of greywater
Brief introduction Characteristics
rainwater organic waste faeces (brown water) filtration, biological treatment composting, anaerobic digestion anaerobic digestion, drying, composting water supply, groundwater recharge soil improvement, biogas biogas, soil improvement Separated „waste“ streams are easier to treat and reuse urine (yellow water) greywater (shower, washing, etc.) Substance storage constructedwetlands, soil filters, membrane technology Treatment examples Source: GTZ-ecosan project, resource book N-rich fertiliser irrigation, groundwater recharge, toilet flushing Reuse = black water (with small amount of flush water)
“Waste” streams discussed in this lecture • Urine • Faeces • Greywater • Anal washwater • Conventional domestic wastewater – for comparison purposes
Course 1 Unit 2 Nutrients: important component of waste streams! A fertiliser which contains these three nutrients is called a “complete” fertiliser • Macronutrients*: • Nitrogen (N) • Phosphorus (P) • Potassium (K) • Sulphur • Calcium • Magnesium • Micronutrients: • Boron, copper, iron, chloride, manganese, molybdenum and zinc TN = total nitrogen, e.g. urea-N plus ammonia-N (for urine) TP = Total phosphorus * The definition of macronutrients and micronutrients for human nutrition is different, see e.g. http://www.fivims.net/glossary.jspx?show_result=true?lang=en#M (or the course glossary)
Role of measurement parameters for urine, faeces and greywater
C1U2 - Part A Characteristics of urine
Human urine quantity facts Human physiology facts: • The body uses urine as a balancing medium for liquids and salts • The kidneys filter urine from the blood • At excretion, the urine pH is normally around 6 but can vary between 4.5 – 8.2 Adults excrete about 0.8 – 1.5 L of urine per day (children about half that amount) depending on time, person and circumstances: • Excessive sweating results in concentrated urine • Comsumption of large amounts of liquid dilutes the urine
Nutrients in human urine • Digested nutrients enter the metabolism and are excreted mostly with the urine and the rest in faeces • Urine contains 88% of excreted N, 67% of excreted P and 73% of excreted K; the remainder is in the faeces • This ratio of nutrient split between urine and faeces appears to be more or less the same worldwide
Urea facts • Of the nitrogen in fresh urine, 75-90% is in the form of urea; the remainder is in the form of ammonium or creatinine • Urea is (NH2)2CO – an organic nitrogen compound (contributing to CODa content of urine) • Urea is easily converted to ammonium by urease (an enzyme excreted by bacteria, that is present everywhere) • In conventional mixed wastewater, about 78% of the total nitrogen is therefore in the form of ammonia already • Urea can be made artificially from ammonia and CO2 and is a popular fertiliser world-wide • Urea has the highest proportion of N of all liquid fertilisers: 46.4% N in urea a COD = Chemical Oxygen Demand (see also Table 1 later in this presentation)
Course 1 Unit 2 Urine storage Fresh (24 March 06) One month old (24 April 06) Fresh (24 March 06) One month old (24 April 06) Three months old (28 June 06) Note the change in colour, increasing cloudiness, sediments (precipitates)
Main processes during urine storage The nitrogen in fresh urine is mostly in the form of urea (75-90%), with very little ammonia Upon storage, the urea is quickly degraded to ammonia (NH3) by the enzyme urease, and hence the ammonia concentration increases Higher ammonia concentrations result in a pH increase to 9 - 9.3 The increased pH value causes a precipitation of certain crystals and precipitates (precipitation of P, Mg, Ca and NH4 occurs) Ammonia (gas) Sludge/ precipitates
Other comments on processes during urine storage • There is a risk of losing N in the form of ammonia with the ventilated air • The colour of the urine changes from bright yellow to orange/red • Sludge forms where urine usually stands for a while • This sludge largely consists of struvite and apatite • It is formed because the pH of the urine increases to 9-9.3 and at this high pH, precipitation of P, Mg, Ca and NH4 occurs • Urine is very corrosive (use plastic or high quality concrete for storage, not metals) – see also Course 2 Unit 3 (Storage and transport logistics) Ammonia (gas) Sludge/ precipitates
Pathogens in urine • Pathogen types: bacteria, viruses, parasitic protozoa and helminths • Number of pathogens in urine is very low • One pathogen of concern is Schistosoma haematobium (causing bilharziasis), where eggs can be excreted in the urine • In areas where this pathogen is endemic, urine should not be used on fields near freshwater sources • Hygiene risks associated with diverted urine are mainly a result of contamination by faeces Urine use in agriculture is “pretty safe” – see more details in Course 2 Unit 1 Part A (Treatment aspects for urine, faeces and greywater)
Chemical contaminants in urine • Heavy metals (Cu, Zn, Cr, Ni, Pb, Cd): • Levels of heavy metals in urine are very low because only substances that have entered the metabolism are contained in urine • Hormones (endocrine disrupters) and pharmaceuticals: • A large proportion of the hormones produced by our bodies and the pharmaceuticals that we consume are excreted with the urine • As a rule of thumb, an average of 64% of a substance ingested is excreted in the urine (Escher et al., 2007) • It is considered better to recycle urine to arable land than to flush the hormones and pharmaceuticals into recipient waters because: • Hormones and pharmaceuticals are degraded in natural environments with a diverse microbial activity • Urine is mixed into the active topsoil and retained for months (see Course 3 “Reuse of ecosan products in agriculture”)
Pharmaceutical residues in urine (continued from previous slide) The load of pharmaceutical residues from animal manure which is freely spread on land has never concerned anyone Some research is ongoing in Europe on this aspect (e.g. ozonation of urine to degrade pharmaceutical residues), but it is not a very important research question for the field of low-cost sanitation (see also Course 2 Unit 1 “Treatment aspects of urine, faeces and greywater”) What is your opinion on this? You can answer on the forum!
Course 1 Unit 2 Nutrient excretion by humans is directly linked to diet N • Diet is the main factor for amount of nutrients excreted • Relationship to calculate the amount of nutrients excreted (in total) from the food intake: • N = 0.13 x total food protein • P = 0.011 x (total food protein + vegetal food protein) • FAO statistics are available for food supply for different countries (see www.fao.org) Excreta Diet N P P
Estimated excretion of nutrients per capita in different countries based on diet (using data and correlation mentioned on previous slide) Source: Jönsson et al. (2004), page 6
Table 1: Excreted mass of nutrients in urine per year (typical values for Sweden) Values are country-specific or diet-specific (treat as guideline only!) cap = capita = person Useful for calculating crop demand or area required for application. Source: Jönsson et al. (2004), and Otterpohl (2003) for COD data; BOD assumed to be half of COD COD and BOD are measures of organic content; see lecture on “Fundamentals of conventional biological wastewater treatment”
Table 3: Urine data - same data as in Table 1 but given as concentrations Concentrations are useful when working with urine of unknown number of people Results from lab session on 20 Sept 06 with 18 MSc students Urine is highly saline (see next slide)
Some additional information on TDS and EC • For conventional wastewater, the following relationship holds (Metcalf and Eddy, page 56) • TDS (mg/L) ~= EC (mS/cm) x (0.55 – 0.70) or • EC (mS/cm) ~= 1.6 x TDS (mg/L) • Pure urine is not to be used as irrigation water, but as a fertiliser • Nevertheless, the classification of water in regards to saltiness is shown below for comparison purposes: Urine
Differences between fresh and stored urine (data set 1) The main difference is the much higher ammonium + ammonia concentration in stored urine The table does not include data for ortho-P, but it would be lower in the stored urine than in the fresh urine (soluble P is precipitating to form various crystals) Source: Novaquatis research project, published in Eawag News (March 2007) http://www.eawag.ch/services/publikationen/eanews/news_63/en63e_maurer.pdf
Differences between fresh and stored urine (data set 2) Source: Determinations at UNESCO-IHE laboratory with class during Ecosan Summer School in Sept. 2006. Values are averages of 6 groups (old urine sample was 7 months old; fresh urine samples were different for each group (taken on same day)). How about letting your own students do some determinations? It is a good experience…
C1U2 - Part B Characteristics of faeces
Course 1 Unit 2 Faeces quantity and content • Faeces consist mainly of non-metabolised material combined with some metabolised material • Undigested nutrients are excreted with the faeces • The lower the digestibility of the diet, the higher the mass of faeces excreted per day, e.g.: • Average person in Sweden: 51 kg/cap/yr (wet mass) • Average person in China: 115 kg/cap/yr • Average person in Kenya: 190 kg/cap/yr • Extremely high number of many different pathogens • Heavy metal content in faeces is higher than in urine (heavy metals pass through the intestine unaffected) • Concentrations of contaminating substances in faeces are usually lower than in chemical ferilisers (e.g. cadmium) and farmyard manure
What does it look like when faeces dry out? This is one of the daughters of Elisabeth Children have no problem with faeces… This is actually a bucket latrine for children
Air drying of faeces 2 days old (16 May 06) Fresh faeces (14 May 06) 6 weeks old (28 June 06) 2 weeks old (1 June 06)
Trial # 1 Faeces of a 2.5 year old girl After two weeks of drying: appears totally dry, Dead flies: container was covered but holes in lid, flies could not get out (??)
Course 1 Unit 2 Table 4: Excreted mass of nutrients in faeces per year (typical values for Sweden) Values are country-specific or diet-specific (treat as guideline only!) Useful for calculating crop demand or area required for application Source: Jönsson et al. (2004), and Otterpohl (2003) for COD BOD assumed to be half of COD
Table 5: Faeces data - same data as in Table 4 but per day this is the mass of wet faecal matter excreted per person per day this is the mass of faeces after drying, per person per day For comparison: solid waste production is 200 – 500 g/cap/d in cities in India (Source: Rothenberger et al., 2006, page 93)
Table 6: Faeces data - same data as in Table 4 but given as concentrations in g/kg wet mass Useful when working with faeces of unknown number of people How to measure the organic content (COD and BOD were developed for liquids)? • Volatile solids content or ignition loss; TOC How to measure pH? • Dilution with water + shaking, or pH meter for soil
Main differences between fresh and old (dried) faeces (collected without flush water) The old, dried faeces has: • Less moisture, volume, weight, density • Much fewer pathogens (note: of all the pathogens, the helminth eggs are most resilient) • No attractiveness for flies anymore • A much less offensive appearance to the human eye Note: These points do not apply for old faeces which is stored together with water and urine!
C1U2 - Part C Characteristics of Greywater
Greywater - definition • Greywater is domestic wastewater with no or minimal human excrements • Sources are kitchens, baths, showers, laundry, washing • Some faecal matter enters if nappies are washed in the laundry for example (households with pit latrines automatically have a “source separation” of greywater)
Greywater quantities generated • Range: 60 – 275 L/cap/d (depending on country and wealth/attitude of user) • Some new houses in Germany, Norway, Sweden: less than 100 L/cap/d • Rural Jordan example: 20 L/cap/d (water is precious, so is used several times) • Note: Basic lifeline water requirement: 25 or 50 L/cap/d (Gleick, 1998) • For comparison: Drinking water requirement: 3-5 L/cap/d
Greywater characteristics: organic matter, nutrients, pollutants • Organic matter (BOD): High concentrations of easily degradable organic material, e.g. fat, oil and other organic substances from cooking, residues from soap, shampoos and tensides from detergents • Nutrients: • Nitrogen levels low • Phosphorus input from washing and dish-washing powder (for water softening) – some countries, e.g. Norway, have banned washing powder containing P • Metals and other toxic pollutants: Metals originating from water itself, corrosion of pipe system, dust, cutlery, dyes, shampoos (similar to conventional wastewater) Source: Ridderstolpe (2004)
Greywater characteristics: pathogens • Proportion of pathogens is low (some faecal contamination possible) • Greywater has lower pathogen content than treated effluent from most conventional wastewater treatment plants (unless they include tertiary treatment for disinfection) • Amount of faeces in greywater: • Based on measured faecal sterols, the estimate is that about 0.04 g/cap/d of faeces is mixed into the greywater (compared to 30 g/cap/d of faeces produced, i.e. 0.1%) • Note: use of indicator bacteria to measure the amount of faeces in greywater might be misleading because of their growth on organic matter that is contained in greywater Source: Ridderstolpe (2004)
Course 1 Unit 2 Table 7: Greywater characteristics Only to provide an idea – highly variable and dependent on water use patterns Concentrations are based on Otterpohl (2003) mass flows, and flowrate of 60 L/cap/d
Anal cleansing materials used world-wide • Toilet paper: collect in faeces compartment of UDD toilet if material to be composted or incinerated, otherwise store separately • Water (see next slide) • Vegetable materials: collect in faeces compartment • Stones or rags: collect separately • Newspaper, card board: treat same as toilet paper Note: absence of available anal cleansing material next to the toilet can lead to higher incidence of diarrhoea (Herbst (2006) proved this correlation for a case study area in Uzbekistan)
Anal washwater • Origin: Practise of many cultures (e.g. Muslims and Buddhists) to wash anal area after defecating and after urinating* • = Water with a low level of faecal matter • Treatment methods for anal washwater similar to those for greywater, e.g. constructed wetlands, soil infiltration • Poorly characterised (few studies) • Should not be mixed with urine; can be mixed with greywater * Therefore, there are no public free-standing urinals for men in muslim countries – only in cubicles
Table 8: Summary table of mass of nutrients in urine, faeces and greywater For greywater used 60 L/cap/d (quite low consumption) Source: Jönsson et al. (2004), and Otterpohl (2003) for greywater data and COD. BOD assumed to be half of COD
Course 1 Unit 2 Volume of greywater, urine and faeces Greywater urine faeces 24,000 – 100,000 L/cap/yr Can be a good source of irrigation water if managed safely L/cap/year 500 L/cap/yr 50 L/cap/yr Source: Otterpohl (2003) Mind that there is a large variation in volume (related to country and standard of living) – 66 to 274 L/cap/d
K P N Mass of nutrients greywater urine faeces This is a „complete“ fertiliser (= containing N, P, K) kg/cap/year Source: Otterpohl (2003)
Mass of organic matter (measured as COD) greywater urine faeces Highly beneficial when applied to soil as soil conditioner (see Course 3 Unit 1 „Reuse of ecosan products in agriculture) kg/cap/year Source: Otterpohl (2003)
For comparison: conventional domestic wastewater • Conventional domestic wastewater is wastewater from households connected to a sewer system, without any separation of waste streams • Polluted water with high levels of pathogens • Large volumes that need treatment • Industrial effluent (untreated or pre-treated) is mostly mixed together with domestic wastewater • Rainwater and sewage are mixed intentionally (combined sewer) or mixed partially (separate sewer) – it is difficult to keep rainwater completely out of sewers, unless they are brand new
Course 1 Unit 2 Table 9: Overview of characteristics of “waste” streams L Low M Medium H High N/A Not applicable Toxic substances: heavy metals, pesticides, chlorinated organic compounds etc.
Table 10: Comparison with conventional domestic wastewater Source: Otterpohl (2003) (for faeces, urine and greywater data) a For US conditions: 260 L/cap/d, 16 gN/cap/d, 1.5 g P/cap/d, 68 gBOD/cap/d, 150 gCOD/cap/d cap = capita = person