Download
1 / 162
1.68k likes | 2.1k Vues
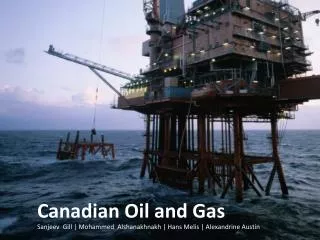
Canadian Oil and Gas. Presented by: Raphael Stephanie Beatrix Vincent. Agenda. 1. Canadian Oil and Gas Industry. 2. Imperial Oil. 3. Suncor Energy. 4. Encana. Canadian Oil and Gas. Industry Analysis. Table of Contents Industry Overview Industry Analysis

E N D
Canadian Oil and Gas Presented by: Raphael Stephanie Beatrix Vincent
Agenda 1. Canadian Oil and Gas Industry 2. Imperial Oil 3. Suncor Energy 4. Encana
Canadian Oil and Gas Industry Analysis Table of Contents Industry Overview Industry Analysis Sensitivity Analysis Trend Analysis Market Analysis Recommended Strategy By: Raphael Kan
Industry Overview National Economic Importance: • Energy Sector contribute 5.6% ($62.8 billion) to Canadian GDP in 2003 • Canadian Oil and Gas Industry accounts for 38% ($23.8 billion) of the Energy Sector contribution • In 2003, new capital investment in energy related industries represented 18.6% of total Canadian investment • Combined, Toronto Stock Exchange and TSX Venture Exchange have 413 Oil and Gas Companies with a total value of over $299 billion. • The Oil and Gas Industry itself accounts for more than 18% of the TSX total market capitalization
Industry Overview Key Stats - Oil • Total production of 3.1 million barrels per day in 2004 • Seventh largest in the world • 99% of its export goes to U.S (largest source of oil for US) • 179 billion barrels of proven reserve in 2005 • Second largest in the world • Able to produce at current rates for the next 150-200 years
Industry Overview Type of Crude Oil produced in Canada • Light crude oil: liquid petroleum with a gravity of 28°API or higher • Heavy crude oil: liquid petroleum with a gravity below 28°API • Bitumen: petroleum in semi-solid or solid form that is found in bituminous sands. It is so heavy (gravity below 12°API) and viscous that it will not flow unless heated or diluted. • Synthetic crude oil: a product similar to a high-quality light crude oil. It is made by refining or upgrading heavy oil or bitumen. • Condensates: hydrocarbons recovered from a natural gas reservoir. • Pentanes: hydrocarbons containing molecules of 5 carbon atoms and 12 hydrogen atoms.
Industry Overview Sources of Canadian Oil Production: • Offshore: Off the Atlantic coast of Newfoundland • Conventional Oil: Western Canada Sedimentary Basin • Oil Sands: Northern Alberta and Canadian Arctic
Industry Overview Conventional vs Oil Sands: Conventional Oil • Petroleum found in liquid form, flowing naturally or capable of being pumped without further processing or dilution • Cheaper to produce Oil Sands Synthetic Crude Oil • Oil Sands is a thick mixture of sands, bitumen, mineral rich clays and water • Synthetic crude oil is extracted from oil sands and it is often sold at a premium because of its high quality • More costly to produce • No drilling risk for the near surface oil sands
Industry Overview Synthetic Crude Production Process: Ore Preparation • Strip-Mining • The pick and shovel method used to recover oil sands that are near surface • 600,000 barrels per day 1.2m barrels per day in 2010 • In Situ • Includes various methods used to recover deeply buried bitumen deposits, including steam injection, solvent injection and firefloods • 380,000 barrels per day 700,000 barrels per day in 2010 • More than 80% of the Oil Sands reserve require this method Extraction • Separates Bitumen from other molecules Upgrading • Processes Bitumen into Synthetic Crude Oil and Vacuum Gas Oil
Industry Overview Key Stats – Natural Gas • Total production of 6.6 trillion cubic feet in 2002 • Third largest in the world • Almost all of its export goes to U.S. • 56.1 trillion cubic feet of proven gas reserve in 2005 • Only ranked 19th in the world • At current rates, production will deplete in 8.6 years
Industry Overview Sources of Canadian Natural Gas Production: • Western Canadian Sedimentary Basin • Atlantic Coast • Arctic
Industry Overview Industry Components • Upstream • Exploration and Production • Midstream • Pipeline, Transportation and Storage • Downstream • Refining, Marketing and Retailing
Industry Analysis Top 15 players by market capitalization TSX Capped Energy Average TSX Composite Average 12.94 11.28 10.59 7.89
Industry Analysis The Canadian Advantage • Canada is the world leader of • Enhanced recovery techniques for mature reservoirs • Cold climate and offshore production • Gas processing, sulphur extraction and heavy oil upgrading • Oil Sands reserve • Development of Oil Sand projects • Integrated with the world’s largest market for energy consumption, making it less costly to bring the products to market. • Strong interest from China, the largest market for energy consumption in the future. • Attractive crown royalty rate for oil sand projects
Industry Analysis Risks and Constraints • Tighter environmental regulation • Kyoto Protocol • Limited proven natural gas reserve • Long run viability of oil sands project • It is estimated that crude price has to be above $25 a barrel for oil sand projects to be profitable because of the high production costs Factors that would determine the viability include: • Invention of new drilling and refining technology • Presence of alternative source of energy • Oil production level of major producers such as OPEC and Russia
Sensitivity Analysis Regress TSX Capped Energy Index with Crude Oil Spot Price between 2001 to 2005 • R Square = 0.9116 • Slope Coefficient = 4.3328 • (A dollar change in crude price 4.3328 change in the Energy Index or 1.4467% change in the Energy Index as of Nov 7, 2005) Scattered Plots Strong correlation
Trend Analysis Factors that would affect energy prices • Short term supply and demand • Rate of investment in the long term • Sentiments • Accidents such as • Bad weather • Halting transport of oil from producers • Labour disputes (strikes) • War • Natural disaster • Taxes • - Crude price now represents less than a quarter of the price of oil products • in many countries. Thus, taxes have significant influence over the price of • oil products
Trend Analysis - Oil Global Oil Supply • Upward trend since 1985 Million barrels per day
Trend Analysis - Oil Global Oil Demand & Forecast • Expected to grow by more than 50% in the next 20 years • More than 50% are consumed by the transportation sector
Trend Analysis - Oil Global Oil Demand & Forecast • Emerging Asia, especially China is expected to more than double its demand in the next 20 years.
Trend Analysis - Gas Global Natural Gas Demand and Forecast • Expected to grow at a slightly higher rate than crude oil demand
Market Analysis Correlation between Oil and Natural Gas Prices
Market Analysis Historical Oil Price Analysis • Even at the current $60 level, the impact on consumers is not as big as in the early 80s during the Iran and Iraq war Iran & Iraq war War on “terrorism” OPEC 10% Quota Increase Asian Economic Crisis Gulf War Iranian revolution Series of OPEC cuts
Market Analysis Comparison of TSX Capped Energy Index against TSX Composite and S&P 500 from 2001~2005 TSX Capped Energy Index Outperform by more than 100% TSX Composite Index S&P 500
Market Analysis Market Outlook • Prices of petroleum products and natural gas will remain high due to tight international supplies and hurricane induced short term supply losses • Many fund managers still favour the energy sector though some has started shifting assets to the consumer staple sector based on the sector rotation model • Very few analysts and industry executives believe that the crude price will ever fall back to the level of $30 per barrel
Recommended Strategy One should look for: • Larger companies with strong financial resources • Companies that have good track records of positive relationships with all stakeholders • Companies that have strong presence in oil sands but are relatively diversified • Companies that already demonstrate superior cost structure and lower production costs. Selection Criteria For Long Term Investment
Imperial Oil by Stephanie Zhang
Background • History • Founded in 1880, Ontario. • 6% of total Canadian primary energy supply • Head Office: Calgary in 2005 • Stock trading symbol: IMO • Stock Exchanges: TSX, AMEX. • Current price: $87.29. Rating: AAA • 69.9% shares, Exxon Mobil Corporation
Corporate Profile Largest integrated in Canada -market cap: C$40 billion -2004-EAT $2.1 billion; ROCE 28% Largest producers of crude oil and natural gas -360,000 oil-equivalent barrels a day Largest petroleum producers -ESSO Largest chemical producers
Imperial Management • CEO: Tim J. Hearn • Business Strategy • Increase long-term shareholder’s value • Invest in attractive growth opportunities
Business Segments • Three product segments: • Natural Resources (Upstream) • Conventional Oil and Gas • Oil sands operation • Petroleum Products (Downstream) • Refining, distributing and marketing • Chemicals
Natural Resources • Conventional oil and gas • Nine conventional oil and gas sites • The Mackenzie gas project • Oil sands operation • Cold Lake • Syncrude • Drilling lease at Kearl
Development of Canadian onshore gas resources in 2004 1220-kilometre natural gas pipeline system Co-venture with ConocoPhillips, Shell Canada, ExxonMobil Canada and the Aboriginal Pipeline Group. Total project investment is estimated at $7 billion. Halted in 2004. Mackenzie gas project
Oil sands operation • Cold lake • Wholly owned, 1960’s. • largest thermal heavy-oil recovery operations in the world. • Syncrude • largest oil-sands project in the world, 1975 • 60,000 barrels a day for Imperial. • Drilling lease at Kearl
Kearl • Mining project with ExxonMobil Canada at Fort McMurrary, in 2004. • Imperial Oil (70%) and ExxonMobil Canada (30%) • Estimated cost 4.5 –6.5 billion • 300,000 barrels per day over 40 years
Petroleum Products Segment • The largest producer and marketer of petroleum products in Canada. • 1916 Gasoline Station • 2005 A network of 1,978 Esso service stations across Canada. -Four refineries in Canada.
Intense competition Surplus capacity Environmental legislation and low return on investment Challenges in Petroleum Market
Chemicals Segment • The Chemicals segment manages the technology, manufacturing, marketing and distribution of petrochemicals, and markets its products both domestically and internationally. Imperial is one of the largest chemical manufacturers and marketers based in Canada.