
VFW
RECHARGE TO THE MEMPHIS AQUIFER IN SOUTHWESTERN TENNESSEE, AN EXAMPLE OF A SAND-DOMINATED COASTAL PLAIN AQUIFER IN A HUMID REGION.

VFW
E N D
Presentation Transcript
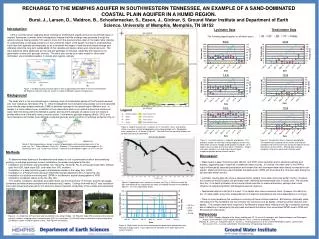
RECHARGE TO THE MEMPHIS AQUIFER IN SOUTHWESTERN TENNESSEE, AN EXAMPLE OF A SAND-DOMINATED COASTAL PLAIN AQUIFER IN A HUMID REGION. Bursi, J., Larsen, D., Waldron, B., Schoefernacker, S., Eason, J., Girdner, S. Ground Water Institute and Department of Earth Science. University of Memphis, Memphis, TN 38152 Introduction Little is currently known regarding direct recharge to the Memphis aquifer across the unconfined region in western Tennessee; however, initial investigations indicate that little recharge may penetrate through the upland surfaces, taking possibly 100 years to move from the ground surface down to the water table. Gaining an understanding of recharge processes in the unconfined region of the aquifer is critical to understanding input rates both spatially and temporally so as to ascertain the impact of land use and climate change and ultimately effect the long-term sustainability of this valuable and heavily relied upon natural resource. The main questions being addressed are the rate and pathways of recharge, especially with respect to the geomorphic context and geologic controls. This effort also serves as a useful model for other sand-dominated unconsolidated aquifers in coastal plain regions, globally. Lysimeter Data Tensiometer Data The following legend applies to all below graphs: BS SS GF VF SS 2in. VFW DPW SS 4in. Figure 1. (A) Map showing research region in Mississippi Embayment within the central United States. (B) Regional map with study site shown in relation to Memphis aquifer recharge area. Background The study site is in the unconfined region (recharge area) of the Memphis aquifer at the Pinecrest research site, near LaGrange, Tennessee (Fig. 1). Initial investigations have included using vadose-zone and saturated zone chloride mass balance methods (CMB) to estimate recharge in the upland region (Waldron et al., in review) (i.e. thick vadose zone), installation of two observation wells on an upland surface and continuous water level monitoring within the Memphis aquifer, and recurrent analyses of vadose zone soil moisture profiles within one of the wells using a neutron probe. Furthermore, geologic mapping (Brock, 2012) and reconnaissance soil studies have clarified conceptual geologic and soil control on recharge processes (Fig. 2). Figure 4. Map of research site. Locations of LT nest wells, flume, and weather station are shown relative to topography and surface geologic units. Topographic cross section line A – A’ shown in Figure 5. The Wolf River is a perennial stream, but all other streams are intermittent. Figure 7. Lysimeter volume vs. biweekly precipitation. This provides insight into soil water storage capacity at each nest. Note lower soil water storage at BS location (except for 1.0 m depth), due to sandier texture than other LT locations. Drop in soil water storage in July and August due to higher evapotranspiration during summer months. Figure 8. Tensiometer data vs. biweekly precipitation. Tensiometer data responds to soil texture and moisture conditions with fine textured soils having the highest tension during the summer months. Missing data indicates equipment error or an absence of chamber water. Figure 2. Recharge pathways shown in context of geomorphic setting and geologic units at the study site. Tm – Tertiary Memphis Sand, Qtf – Pliocene (?)-Pleistocene fluvial terrace deposits, Ql – Quaternary loess, Qal - Quaternary alluvium. Paleosols are developed in upper 2 m of Tm and Qtf. • Methods • To determine water balance in the watershed and assess to role of geomorphic position and underlying geology on recharge processes, several installations have been completed at the site. • Installation of 4 lysimeter and tensiometer (LT) nests (Fig. 3A and B, Fig. 4) at shoulder slope (SS), hillslope gully floor (GF), back slope (BS), and valley floor (VF) locations. • Completion of a deep monitoring well in the Memphis aquifer in the valley floor (VFW). • Installation of a Parshall flume along an intermittent stream adjacent to the LT nests (Fig. 3C). • Installation of a shallow monitoring well (DPW) in the Memphis aquifer downgradient of VFW. • Installation of weather station at the site (Fig. 3D). • The weather conditions, discharge, and water levels are monitored every 15 minutes, and the rain gauge, lysimeters and tensiometers sampled and checked every 2 weeks. Cuttings from well and LT nest installation have been sieved and analyzed for soil texture to assess hydraulic conductivity of the surface and subsurface materials. • Discussion • Water levels in deep monitoring wells (SS 2in. and VFW) show opposite trend to seasonal wetness and dryness, suggesting lag in response or additional water sources. In contrast, the water level in the DPW is highly influenced by seasonal precipitation and stream flow, with increased water level directly connected to rain events. Data from previous years indicates the water level in DPW will drop below the other two wells during the fall and early winter months. • Lysimeter volume data also show a seasonal trend, yielding more water during the wetter months. However, the volumes at the BS location are generally lower, reflecting downward water loss in sandy soils. The volumes from the 1.5 m depth lysimeters show a more muted response to seasonal moisture, perhaps due to less influence of evapotranspiration and delayed seasonal response. • Tensiometer data for both the 0.5 m and 1.0 m depths also show a seasonal trend. However, the data from the 1.5 meter depthshow more independence from seasonal precipitation and more dependence on soil type. • There is strong evidence that recharge is occurring at these hillslope locations. BS location continually yields little water from the lysimeters and has similarly low soil tensions at all depths, reflecting sandier textures at all depths. The complex water level response in the Memphis aquifer likely reflects a time lag in seasonal increase due to deflection of recharge by the clay beds and lateral translation from unconfined (DPW) area to VPW and SS areas with clay barrier. Figure 5. Topographic cross section at research site (Fig. 4). Wells are shown by bars extending into the subsurface; bar color corresponds to water levels plotted in Figure 6. LT nests indicated by arrows. References Brock, C.F., 2012, Geologic Mapping of the Macon and Moscow SE 7.5-minute Quadrangles with Sedimentological and Petrological Analysis of the Memphis Sand: unpublished Masters Thesis, University of Memphis, 83 p. Waldron, B., Larsen, D., Schoefernacker, S., Garner, C., Recharge processes to the unconfined Memphis aquifer, southwestern Tennessee, U.S.A., in review, submitted to Environmental & Engineering Geoscience. Figure 3. (A ) Gully floor (GF) lysimeter and tensiometer nests along hillslope. (B) Shoulder slope (SS) lysimeter and tensiometer nest with students sampling waters; monitoring well (SS 2 in) in metal box. (C) Parshall flume in intermittent stream along valley. (D) Weather station in field on upland surface. See Figure 4 for locations. Figure 6. Water levels for the three monitoring wells plotted with precipitation from February to August 2014. Each represent the elevation of the water table at the various locations.