Pinal County PM10 Exceptional Event Analysis – August 13, 2007
On August 13, 2007, Pinal County experienced an exceptional air quality event due to strong winds from developing monsoon cells. Wind speeds peaked at 32 mph, resulting in three PCAQCD monitors exceeding the 24-hour PM10 National Ambient Air Quality Standards (NAAQS). Notably, the highest recorded PM10 concentration was 6,365 µg/m3 in Maricopa during a brief period, an anomaly attributed to high winds that evening. This event was flagged by ADEQ, prompting further analysis of its impact on air quality before and after the incident.

Pinal County PM10 Exceptional Event Analysis – August 13, 2007
E N D
Presentation Transcript
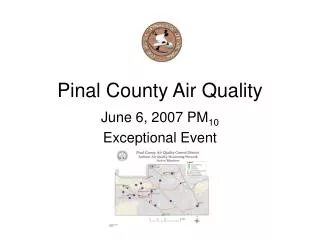
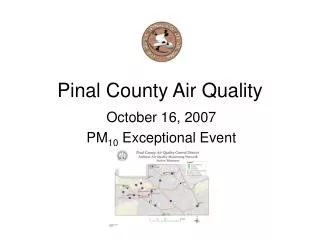
Pinal County Air Quality August 13, 2007 PM10 Exceptional Event
August 13, 2007 • Strong winds associated with monsoon cells that developed over the county late on August 13th. Max winds reached 32 mph which caused three PCAQCD monitors to exceed the 24-hr PM10 NAAQS. Site 24-hr PM10 Conc. (ug/m3) Maricopa 331.7 Combs 248.4 PCH 202.6 * August 13, 2007 also flagged by ADEQ as an exceptional event.
5 p.m. local time Cells developed to the south and east of the county and moved through during the evening of 8/13/07 which provided the wind that caused the elevated PM10 in Pinal County
6 p.m. local time Cells developed to the south and east of the county and moved through during the evening of 8/13/07 which provided the wind that caused the elevated PM10 in Pinal County
7 p.m. local time Cells developed to the south and east of the county and moved through during the evening of 8/13/07 which provided the wind that caused the elevated PM10 in Pinal County
8 p.m. local time Cells developed to the south and east of the county and moved through during the evening of 8/13/07 which provided the wind that caused the elevated PM10 in Pinal County
9 p.m. local time Cells developed to the south and east of the county and moved through during the evening of 8/13/07 which provided the wind that caused the elevated PM10 in Pinal County
10 p.m. local time Cells developed to the south and east of the county and moved through during the evening of 8/13/07 which provided the wind that caused the elevated PM10 in Pinal County
11 p.m. local time Cells developed to the south and east of the county and moved through during the evening of 8/13/07 which provided the wind that caused the elevated PM10 in Pinal County
8/13/07 “But for” Test • Had it not been “but for” the high winds between 10-11 p.m. associated with the cell development from east to west over the county which caused Maricopa to have a 1-hr PM10 concentration of 6,365 ug/m3, Maricopa would have NOT exceeded the PM10 24-hr NAAQS. • If the 6,365 ug/m3 was replaced with the average of the other 23 hours then the 24-hr PM10 concentration would be 69 ug/m3 • PCH – 50 ug/m3 • Combs* – 85 ug/m3 * Substituted 2 highest hours caused by the high winds with average of other 22 hours.
Additional 8/13/07 “But for” Test • Maricopa had the following 24-hr PM10 concentrations before/after the 8/13/07 event • 8/12/07 – 44.2 ug/m3 • 8/14/07 – 28.9 ug/m3 • Combs • 8/12/07 – 59.9 ug/m3 • 8/14/07 – 72.0 ug/m3 • PCH • 8/12/07 – 50.1 ug/m3 • 8/14/07 – 26.8 ug/m3