Download
1 / 21
210 likes | 327 Vues
On June 6, 2007, strong winds from a front transported dust into Pinal County, causing PM10 levels to exceed the 24-hour NAAQS at four monitoring sites. Maximum wind speed reached 28 mph. The event was flagged as exceptional by ADEQ and highlighted the importance of the county's new AQI forecasting program initiated around June 1. This program conservatively predicts air quality, with the June 6 forecast verifying after a previous day’s exceedance did not. Ongoing monitoring remains crucial for public health and environmental management.

E N D
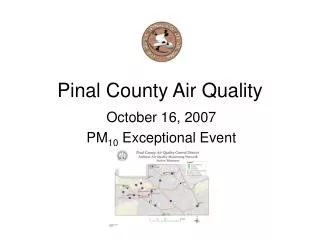
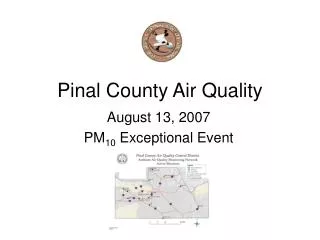
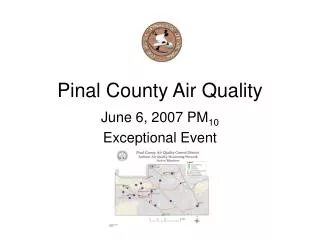
Pinal County Air Quality June 6, 2007 PM10 Exceptional Event
June 6, 2007 • Strong winds associated with a front helped transport dust from areas outside of the county. Max winds reached 28 mph which caused four PCAQCD monitors to exceed the 24-hr PM10 NAAQS. Site 24-hr PM10 Conc. (ug/m3) PCH 414.2 Combs 360.5 Stanfield 273.4 Maricopa 213.4 * June 6, 2007 also flagged by ADEQ as an exceptional event.
Pinal County Started an AQI forecasting program around June 1, 2007. Typically, the “Today” AQI is a carry forward forecast from the previous day since the PM10 TEOM data isn’t provided throughout the day. The AQI forecasting effort is rather new and we err on the conservatively high side of the forecast, therefore the 6/5/07 PM10 exceedance didn’t verify. However The 6/6/07 AQI forecast did verify. The daily AQI forecast is on the web at http://co.pinal.az.us/AirQual/pdf/forecast/aqforecast.pdf
6/6/07 “But for” Test • PCH had the following 24-hr PM10 concentrations before/after the 6/6/07 event • 6/5/07 – 101.1 ug/m3 • 6/7/07 – 98.7 ug/m3 • Combs • 6/5/07 – 113.7 ug/m3 • 6/7/07 – 106.9 ug/m3 • Stanfield • 6/5/07 – 129.9 ug/m3 • 6/7/07 – 136.2 ug/m3 • Maricopa • 6/5/07 – 126.8 ug/m3 • 6/7/07 – 101.3 ug/m3 NOTE: The winds may have not been As strong as other previously noted Exceedance days. However the seasonal PM10 “background” at this time of year is significantly higher and therefore Doesn’t take much wind to exceed the PM10 NAAQS. As a Result had it not been (i.e. “but for”) for this atypical* frontal passage (i.e. exceptional) these monitors would NOT have exceeded the PM10 NAAQS. • *Source: http://www.hpc.ncep.noaa.gov/dailywxmap/ • Only frontal passage for June 2007. No frontal • Passages for June 2006 as a comparison.