Download
1 / 52
530 likes | 686 Vues
Arctic Mixed-Phase Clouds and Their Simulations in Climate Models Shaocheng Xie Atmospheric, Earth and Energy Division Lawrence Livermore National Laboratory. My Background. Atmospheric scientist at LLNL

E N D
Arctic Mixed-Phase Clouds and Their Simulations in Climate Models • Shaocheng Xie • Atmospheric, Earth and Energy Division • Lawrence Livermore National Laboratory
My Background • Atmospheric scientist at LLNL • Have been working on climate model, climate model evaluation, cloud parameterization development, and field data analysis in the past 20 years • Have some knowledge on cloud microphysics, but not much
Outlines • A brief description on climate model • Issues with representing clouds in climate models – a brief history of cloud parameterization • Why Arctic mixed-phase clouds • Issues with the treatment of mixed-phase clouds in current climate models • Ice nucleation and growth and its interaction with liquid not appropriately represented - oversimplified • Bergeron Process 15 minute Break
Outlines • Model evaluation: how to test microphysical parameterizations used in climate models? • Field measurements (M-PACE) • Modeling approaches (CAPT – run climate model in short-range weather forecast) • Model vs. Data • Sensitivity of climate simulations to ice nucleation schemes • Summary
Model dynamics p, T, u, v, q… Model physics P(M, R, S, T) A Little Background: Climate Models • Climate Models are systems of differential equations based on the basic laws of physics, fluid motion, and chemistry. • Momentum (u, v) • Continuity (w) • Thermodynamic (T) • Moisture (q) Horizontal resolution: 100-200km Vertical resolution: ~50 hPa
A Little Background: Clouds Clouds Impact on Radiations, Hydrological Cycle, and more … • Global cloud cover: 60% • Two competing effects: • Reflect solar radiation back to space ~ 60 W/m2 • Trap infrared radiation emitted by the surface and low troposphere ~ 30 W/m2 • Depend on macrophysical and microphysical properties • Type, location, altitude, amount • Water content and Phase: ice or liquid? -> effective radius and optical depth • A net cooling effect
GCM Grid cell 100-200km Clouds in Climate Models - What are the problems ? Many of the observed clouds and especially the processes within them are subgrid-scale processes (both horizontally and vertically) Parameterization is needed Slide from Joyce Penner and Adrian Tompkins (modified by Xie)
radiation convection turbulence microphysics Large scale dynamics Clouds in GCM - What are the problems ? Clouds are the result of complex interactions between a large number of processes Slide from Joyce Penner and Adrian Tompkins (modified by Xie)
Cloud Schemes - A Brief History Slide from Joyce Penner
Cloud Schemes - A Brief History Slide from Joyce Penner
Cloud Schemes - A Brief History Slide from Joyce Penner
Cloud Schemes - A Brief History Slide from Joyce Penner
Cloud Schemes - A Brief History Slide from Joyce Penner
Clouds: Still A Major Source of Uncertainty in Climate Models • Cloud Radiative Forcing • W/m2 • Figure from IPCC Fourth Assessment Report (2007) Cloud Radiative Forcing: RAD_cld - RAD_clr at TOA Figure shows globally averaged cloud radiative forcing changes for 2080-2090 under the A1B scenario for individual models. A1B: one emission scenarios defined by IPCC (Intergovernmental Panel on Climate Change) • Model ID Number
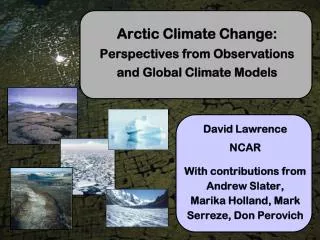
Arctic is experiencing the most rapid changes in climate • Stroeve et al. (2008) • Sea ice is declining faster than most IPCC models predict. Slide from Tony Del Genio
Why Mixed-Phase Clouds? • The definition of mixed-phase clouds is those clouds that contain both ice and liquid • Occur 40% of the time in Arctic • Dominate low-level Arctic clouds during cold seasons • The phase partitioning between liquid and ice in the mixed-phase clouds could have a large impact on the model predicted climate change • The treatment of mixed-phase clouds in most current climate models is often oversimplified • Ice nucleation and growth and its interaction with liquid not appropriately represented • Bergeron Process
Why Arctic Mixed-Phase Clouds? • Cloud phase is a major source of uncertainty in models • OBS • Klein et al. (2009)
How Do Climate Models Determine the Cloud Phase? • CAM3 – an earlier version of the NCAR Community Atmospheric Model (used before April 2010) • Rasch & Kristjansson (1998) • single-moment to predict only mixing ratio of cloud condensate, liq/ice fraction determined by T All ice when T < - 40C, all liq when T > -10C • AM2 – the climate model developed by GFDL (Geophysical Fluid Dynamics Laboratory) • Rotstayn (1997) and Rotstayn et al. (2000) • Single-moment, liq/ice fraction determined by the Bergeron process -- the ice crystal growth by vapor deposition at the expense of coexisting liquid water • CAm3Liu: An improved scheme for CAM3 (Liu et al., 2007) – part of the scheme being used in CAM4/CAM5 • Double-moment to predict both mixing ratio and number density, liq/ice fraction determined by the Bergeron process (Rotstayn et al. 2000)
More on Cloud Microphysics • Single-Moment vs. Double Moment • Single-moment: q • Double-moment : both q and N • Single-moment cannot represent aerosol-cloud coupling • The coupling requires a prognostic equation for the number concentration of cloud droplets so that the impact of aerosols on the cloud droplet number can be realistically represented • Aerosol-Cloud-Radiation interaction is one the key processes missing in many current climate models!
More on Cloud Microphysics • Bergeron (or Bergeron-Findeisen) Process • A process that describes the formation of precipitation in the cold clouds by ice crystal growth. • Water vapor, ice and liquid coexist in the mixed-phase clouds • esw > esi • In mixed-phase clouds, the air is saturation wrt the liquid droplets, but it is supersaturated wrt the ice crystals ==> water vapor will deposit on the ice crystals ==> leads to unsaturated air with respect to liquid ==> the liquid droplets will evaporate until the air once again reaches saturation. The process then continues. In short summary, the ice crystal grows by vapor deposition at the expense of liquid water
How is the Bergeron Process Parameterized in Climate Models? Bergeron process is parameterized based on Rotstayn et al. (2000) dqi/dt ~ Ni , (esw – esi)/esi AM2: 1) Ni is diagnosed following Meyers et al. (1992) Ni = exp[12.96(esl - esi)/esi - 0.639] 2) Assume that the saturation vapor pressure is with respect to liquid esw=esl CAM3LIU: 1) Ni is predicted by considering the processes of advection, convective transport, ice nucleation, droplet freezing, etc. 2) assume that the saturation vapor pressure is weighted by the proportions of ice and liquid water mass for mixed-phase clouds, ew= fl*esl + (1-fl)*esi
A Schematic of the Model Development Process Jakob, 2010
Climate Model Evaluation • Observational data is needed • Improving mixed-phase cloud parameterizations requires an advanced understanding of cloud and cloud microphysics through carefully planed field studies • Appropriate modeling approach is needed How to link field data to global climate model evaluation and development?
The Mixed-Phase Arctic Cloud Experiment (M-PACE) The DOE Atmospheric Radiation Measurement (ARM) program conducted a campaign at its North Slope of Alaska site to study the properties of mixed-phase clouds (10/5/04 – 10/22/04) Barrow
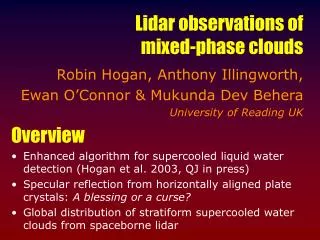
More on M-PACE Cloud Measurements • Millimeter-wavelength cloud radar • Micropulse Lidars • Laser Ceilometers • Aircraft • Microwave Radiometers M-PACE provides extremely valuable information to assess and improve model mixed-phase cloud parameterizations
How to link field data to model evaluations and developments?
CAPT • The U.S. DOE CCPP-ARM Parameterization • Testbed (CAPT) Project • CCPP (Climate Change Prediction Program)– developing, testing, and applying coupled-model for climate predictions • ARM (Atmospheric Radiation Measurement)– collecting field data for testing and improving model cloud and radiation parameterizations • CCPP+ARM Model +Data
What does CAPT do? • CAPT provides a flexible user environment for running climate models in NWP ‘forecast’ mode: • Climate models initialized with analysis data from NWP center’s data assimilation systems • A series of short-range weather forecasts performed • The detailed evolution of parameterized variables compared with field data • link model deficiencies to specific atmospheric processes • Evaluate the nature of parameterization errors before longer-time scale feedbacks develop
Models • NCAR CAM3 FV 1.9x2.5 L26 • GFDL AM2 2.0x2.5 L24 • A series of 3-day forecasts with CAM3 and AM2 were initialized with the NASA Data Assimilation Office (DAO) analysis every day at 00Z for M-PACE. • 12-36 hour forecasts near the Barrow site are analyzed Barrow
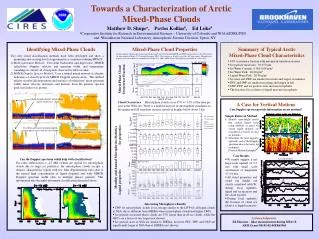
Radar Clouds at Barrow C A B A: Multi-layer clouds B: Persistent mixed-phase boundary layer clouds C: Deep frontal clouds
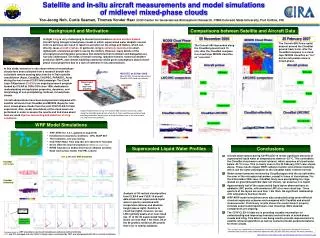
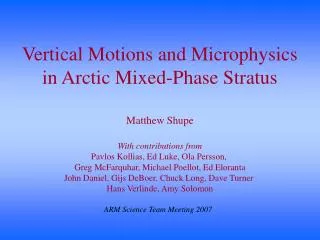
Aircraft Measured CWC Oct. 10, 2004 Liq A strong liquid layer occurred near cloud top at 1300m Ice Ice crystals in the liquid cloud layer and precipitating ice crystals beneath For mixed-phase clouds, the range of cloud temp is from -5 C ~ -20 C
Simulated Clouds • Cloud types • Cloud fraction (d)
Simulated Cloud Liquid Water Mixing Ratio Compared with CAM3Liu, CAM3 produces similar amount of liquid even though its cloud fraction is much lower than CAM3LIU (d) AM2 clouds contain much less liquid than CAM models. Why?
Simulated Cloud Ice Water Mixing Ratio AM2: less ice for BLC CAM3LIU more ice than CAM3 (d)
Liquid Water Path • AM2 contains much less liquid compared to CAM3 -- AM2 may have a faster conversion rate of liquid to ice? ice crystal number concentration relative humidity in mixed-phase clouds
Why does AM2 have less liquid than CAM3Liu? Revisit the schemes Bergeron process is parameterized based on Rotstayn et al. (2000) dqi /dt ~ Ni , (esw – esi)/esi AM2 assumes that the saturation vapor pressure is with respect to liquid esw=esl CAM3LIU assumes that the saturation vapor pressure is weighted by the proportions of ice and liquid water mass for mixed-phase clouds, ew = fl*esl + (1-fl)*esi esw in AM2 is larger than that in CAM3Liu leads to a faster conversion rate from liquid to ice through the Bergeron process
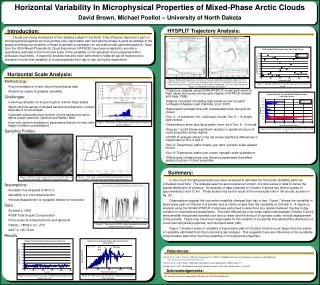
Liquid fraction as a function of cloud height Flights on 9-10 October for the single-layer mixed-phase clouds • Snow component is added to the total cloud condensate to be consistent with aircraft data • Normalized cloud height Aircraft data: liquid dominates, fliq increases with height, ice seen in the lower half of clouds
Liquid fraction as a function of temperature Flights on 9-10 October for the single-layer mixed-phase clouds Aircraft data: no clear relationship, liquid and ice coexist within this temp range The Bergeron process is critical for models to capture the observed characters of mixed-phase clouds
IN Parameterizations Largely Depend on Observations IN measured in midlatitudes usually much larger than that observed in Arctic regions Meyers et al. (1992): Ni = exp[12.96(esl - esi)/esi - 0.639] Meyers et al. (1992) • Meyers et al (1992) produces significantly larger IN concentration than what observed during M-PACE • Prenni et al. (2007) modified the Meyers et al. (1992) scheme to best fit the M-PACE data. Prenni et al. (2007) M-PACE Figure adapted from Prenni et al. (2007) BAMS paper
Sensitivity Test on IN – AM2 AM2N90N – uses the Prenni et al (2007) scheme, which leads to a smaller ice nuclei number concentration
Sensitivity of Climate Simulations to IN Schemes CAM5 is used
More IN Schemes Tested • Meyers et al. (1992): widely used in current climate models, an empirical formulation developed based on midlatitude measurements of ice nuclei concentrations, which are generally much larger than Arctic IN concentration. • Phillips et al. (2008): more physically based; link IN to aerosol (dust and soot) surface area, which generally gives much lower IN number concentrations than Meyers et al. (1992). • DeMott et al. (2010): link IN to aerosol particles (dust) large than 0.5 um based on more than 14-year observations over many regions of globe, which generally gives much lower IN number concentrations than Meyers et al. (1992).
CAM5 Climate Simulation IN Concentration in Mixed-Phase Clouds Meyers et al. (1992) Phillips et al (2008) DeMott et al. (2010) Meyers et al. (1992) produces significantly larger IN number concentration than the other two schemes • Courtesy of Dr. Xiaohong Liu (PNNL)
CAM5 Climate Simulation LWP IWP • Courtesy of Dr. Xiaohong Liu (PNNL)