Download
1 / 19
190 likes | 408 Vues
California Voters and the November 6, 2012 Election: . presented by Mark DiCamillo Director, The Field Poll November 15, 2012 CSU, Sacramento. Table 1. About The Field Poll’s final pre-election survey.

E N D
California Voters and the November 6, 2012 Election: presented byMark DiCamilloDirector, The Field Poll November 15, 2012CSU, Sacramento
Table 1 About The Field Poll’sfinal pre-election survey Population Surveyed: California registered voters considered likely to vote in the November general election. Interviewing Dates: October 17-30, 2012. Sample divided into two approximately equal size interviewing periods -- Wave 1: October 17-24 and Wave 2: October 25-30. Mode of Administration: Landline and cell phone by live interviewers working from Field’s central location call center in San Diego. Number of Interviews: 1,912 registered voters, of whom 1,566 were considered likely to vote. Languages of English, Spanish, Cantonese, Administration: Mandarin, Korean, Vietnamese. Asian Sample Asian-Americans were Augmentation: oversampled and included 440 registered voters to permit comparisons with white non- Hispanic, Latino and African- American voters.
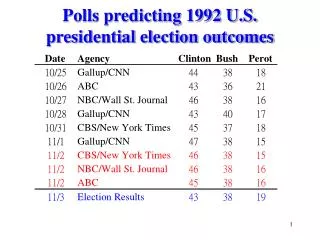
Table 2 Trend of California presidential preferences between Barack Obama and Mitt Romney Source: The Field Poll.
Table 3 Trend of California voter image ratings of Barack Obama Source: The Field Poll.
Table 4 Trend of California voter impressions ofMitt Romney Unfavorable Favorable Source: The Field Poll.
Table 5 Is your preference more a vote for your candidate or a vote against his opponent? Obama Voters Romney Voters Source: Late October 2012 Field Poll.
Table 6 Trend of California voter preferencesfor U.S. Senate Feinstein (D) Emken (R) Source: The Field Poll.
Table 7 Trend of California voter impressions of Dianne Feinstein during this year’s election campaign Favorable Unfavorable Source: The Field Poll.
Table 8 Trend of California voter impressions of Elizabeth Emken Favorable Unfavorable Source: The Field Poll.
Table 9 Trend of California voter preferencesonProp. 30, the Governor’s tax increase initiative Yes voters No voters Source: The Field Poll.
Table 10 Factors affecting voting preferences on Proposition 30 Source: Late October 2012 Field Poll.
Table 11 Trend of California voter preferencesonProp. 31, the state budget reform initiative No voters Yes voters Source: The Field Poll.
Table 12 Trend of California voter preferencesonProp. 32, the payroll deductions for political contributions initiative No voters Yes voters Source: The Field Poll.
Table 13 Trend of California voter preferencesonProp. 34, to repeal the death penalty Yes voters No voters Source: The Field Poll.
Table 14 How views about the death penaltyand life in prison without parole relate tovoting preferences on Prop. 34
Table 15 Trend of California voter preferencesonProp. 38, the Munger tax increase initiative No voters Yes voters Source: The Field Poll.
Table 16 Trend of California voter preferenceson Prop. 39,the business tax for energy funding initiative Yes voters No voters Source: The Field Poll.
Table 17 The growing influence of ethnic votersin the California electorate Source: Totals from the California Secretary of State. Ethnic subgroups are Field Poll estimates.
Table 18 Differences in the party registration of California voters by race/ethnicity Source: Total percentages are from the California Secretary of State, while subgroup percentages are Field Poll estimates


![Election Expenditure Monitoring [EEM] Assembly Elections- 2013](https://cdn1.slideserve.com/3400245/slide1-dt.jpg)