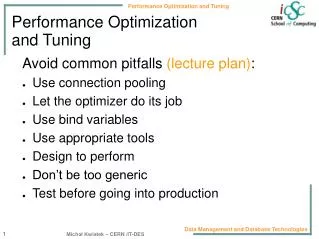
Performance Prediction and Design Optimization
Performance Prediction and Design Optimization. Midn 1/c Jon P. Silverberg. Performance Prediction. The velocity of a ship is inherent to its mission effectiveness Three methods of determination Hydrodynamic Tank Testing Parametric Analysis Computational Fluid Dynamics.

Performance Prediction and Design Optimization
E N D
Presentation Transcript
Performance Prediction and Design Optimization Midn 1/c Jon P. Silverberg
Performance Prediction • The velocity of a ship is inherent to its mission effectiveness • Three methods of determination • Hydrodynamic Tank Testing • Parametric Analysis • Computational Fluid Dynamics
Mk II Navy 44Sail Training Craft • Designer David Pedrick supplied: • Lines Plan • Sail Plan • Parametrically predicted speeds from the IMS Velocity Prediction Program (VPP) • Sailing craft complexities • Six Degrees of Freedom • Propulsion Systems • Lifting Surfaces
Performance Prediction Process • Performance predicted for both motoring (upright) and sailing conditions • Three methods of hydrodynamic analysis • Tank Testing • “FKS” Computational Fluid Dynamic (CFD) code • “SPLASH” CFD code • Upright analysis use only hydrodynamic data • Sailing conditions necessitate aerodynamic data and use of a Velocity Prediction Program
Initial Parametric Analysis • Needed to determine sailing conditions and sail forces which the IMS VPP did not provide • Predictions were performed with University of Michigan’s “PCSail” developed by David Martin • Derived conditions to test in the tow tank
Basic Hydrodynamics • Two main components of Resistance • Wavemaking – determined experimentally • Viscous (friction) – calculated • Speed of the model is scaled to reproduce wavemaking characteristics • Turbulence stimulators are added to reproduce viscous flow conditions • Wavemaking results scaled to ship size • Viscous resistance calculated for ship size
Tow Tank Testing • Data Recorded • Drag • Lift • Yaw Moment • Pitch • Tests included • Upright Conditions • Sailing Conditions • Viscous Corrections • Performed more than 570 runs
FKS – CFD • Developed by Dr. Noblesse at Carderock NSWC • Calculated the far-field wave spectrum • Far-field waves are the totality of wave interactions • Wavemaking resistance is calculated through the energy required to create the far-field waves • Hull had one degree of freedom (forward) • Lift was not calculated • Simulations were fast • FKS was best suited for upright calculations • Initial investigation made on the Wigley hull
Scale effects in tank testing Spray and pitch Viscous interaction in wavemaking Wavemaking Comparison
SPLASH – CFD Development was by Bruce Rosen of South Bay Simulations and Joe Laiosa from Navair at Patuxent River • Calculated inviscid fluid velocities across a discretized hull • Hull had six degrees of freedom • Calculations included upright testing and sailing conditions • SPLASH ran on a high resource system
Pitch Effects Different method of viscous calculations All Upright Data
Sailing Hydrodynamic Data Tank Testing SPLASH Utilized MATLAB and MAPLE to interpolate through sailing matrices
Aerodynamics Analyzed sail forces using basic wing theory Force coefficients from sails derived from IMS VPP Solution Draghydro= Driveaero Lifthydro= Sideforceaero RightingMomenthydro = HeelingMomentaero YawingMomenthydro = YawingMomentaero Mk II Navy 44 VPP Custom VPP had a complex hydrodynamic model and solution but a simplified aerodynamic model
Custom VPP written in Excel using Visual Basic • Created three VPPs from Tow Tank data, SPLASH data, and FKS data (which proved unusable) • Predicted speed for any wind condition and angle Solved by simultaneous equations using finite-difference iteration
Performance Predictions Low wind speeds showed variable results due to simplifications in the aerodynamic model All other wind speeds showed excellent correlation between all velocity predictions
Performance Prediction Conclusions • Tow tank method was limited by scale factors at low model speeds • FKS was limited to upright testing • SPLASH proved a valuable tool when its accuracy was increased with tank data • IMS and PCSail VPP’s provide reliable trends based on extensive hydrodynamic data • Custom VPP provided best results using complex hydrodynamic models • Polars constructed as best fit of all VPP data
Rudder Design • Designer David Pedrick provided an unfinished rudder design for the Mk II Navy 44 • Three design comparisons • Size (Tow tank and SPLASH) • Planform (SPLASH) • Location and Depth (SPLASH)
Size Comparison • Comparison of the Pedrick and “Beaver” rudders • Beaver rudder provided better turning ability and upwind ability in high wind speeds • SPLASH and Tank testing results were similar • SPLASH was used for the rest of the testing based on its accuracy and precision
Baseline Bulge Elliptical Tip Zoid Planform Comparison • Picked different shapes to determine the resulting flow patterns • Each shape was analyzed in SPLASH in under two hours
Planform Results • Picked different shapes to determine the resulting flow patterns • Each shape was analyzed in SPLASH in under two hours Baseline Bulge Elliptical Tip • The Tip rudder was the most efficient rudder • The Tip moved the induced vortex away from the main lifting surface The Tip rudder showed a drag reduction of 0.8% in turning and 0.2% while sailing upwind
Location and Depth Comparison • Forward movement interfered with wake from the keel • Increased depth interfered with keel vortex • No rudder proved better than the baseline • Compared rudders • Moved forward 1.6 ft • Moved forward 3.2 ft • Increased size to maximum draft (85% total draft) • Forward movement thought to reduce drag caused by wavemaking • Size increase thought to increase efficiency by reducing the relative induced drag
Rudder Design Conclusions • The Beaver rudder provided better turning and upwind ability, but was slower downwind • Moving the rudder forward or increasing its maximum draft increased drag • By adding a tip onto the Baseline rudder, the overall performance of the Mk II Navy 44 would be improved • CFD was more effective and efficient at redesigning appendages than tow tank testing
Future Work • Integrate the rudder results into the custom VPP • Larger models should be tested to validate tow tank results • Viscid CFD codes should be used to evaluate the rudder comparisons • An improved Aerodynamic model should be used in the custom VPP • Full-scale testing would validate all of the data once a prototype is built