Download
1 / 14
140 likes | 325 Vues
NC Division of Water Quality Water Quality Assessments and Local Watershed Plans. DWQ Tasks. Compile and review existing data What is known about the watershed What needs to be known to help develop management strategies to improve water quality Develop a monitoring plan

E N D
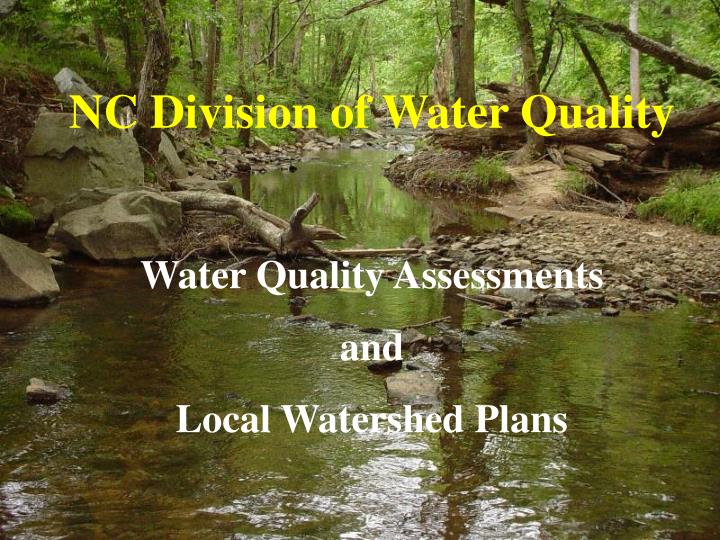
NC Division of Water Quality Water Quality Assessments and Local Watershed Plans
DWQ Tasks • Compile and review existing data • What is known about the watershed • What needs to be known to help develop management strategies to improve water quality • Develop a monitoring plan • Conduct appropriate assessments, e.g. chemical, biological, etc. • Report on results integrating results of all assessments
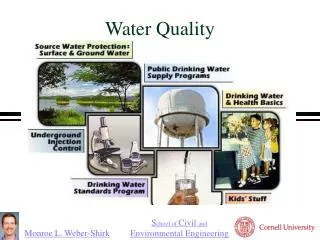
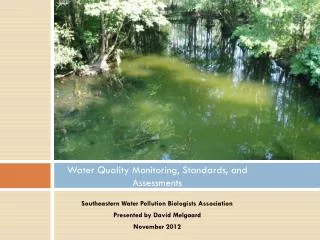
Types of Water Quality Assessments Conducted by DWQ • Chemical Monitoring (includes field measurements) • Biological Monitoring – benthos and/or fish • Habitat Assessments • Wetland Functional Assessments (new in 2008)
Quantitative Can pinpoint locations of problems Identify the specific nature of problems Expensive Requires many samples to characterize pollutant effects in a watershed A sample represents only a single point in time Why Use Chemical Monitoring? Benefits Limitations
Types of Measurements • Field – Dissolved Oxygen, pH, specific conductance, water temperature • Nutrients – Nitrogen and phosphorous • Solids (e.g. total suspended solids) • Turbidity • Metals
Aquatic organisms found in all habitats Easily and inexpensively collected Integrates the effect of mixtures of pollutants over the life cycle of the organism Semi-quantitative Does not identify the source of pollution or the specific pollutants Seasonality & taxonomic inconsistencies Why Conduct Biological Monitoring? Benefits Limitations
Benthic Macroinvertebrates • Benthic- The community of organisms living in or on the bottom or other substrate in an aquatic environment • Macro - Large enough to be seen by the unaided eye and which can be retained by a U.S. standard no. 30 seive (0.6 mm openings) • Invertebrate - animals without backbones
Benthic MacroinvertebratesInclude E Mayfly • Ephemeroptera - Mayflies • Plecoptera - Stoneflies • Trichoptera - Caddisflies • Odonata - Damsel and Dragonflies • Coleoptera - Beetles • Megaloptera - Dobson and Alderflies • Diptera - True Flies • Oligochaeta - Aquatic Worms • Crustacea - Crayfish, Amphipods, Isopods • Mollusca - Snails and Clams P Stonefly T Caddisfly
P T E
Unimpacted Site- greater diversity and number of individuals
Assigning BioclassificationsUsing Macroinvertebrates • Taxa Richness (number of species) • Total number of species • Total number of EPT species • Biotic Index (uses a species’ tolerance to pollution and measures of species abundances) • Species are assigned a “tolerance value” (range 0 to 10) • A Biotic Index (BI; range 0 to 10) is a weighted average of the “abundance” and “tolerance value” • Higher BI values indicate poorer conditions (i.e., more tolerant species present)
NC Division of Water Quality Tom Yocum (336) 771-4953 Steven Kroeger (919) 733-9726 Contact Information: