Distribution Patterns of Hypermethylated CpG Loci in Astrocytomas by Genomic Location
10 likes | 130 Vues
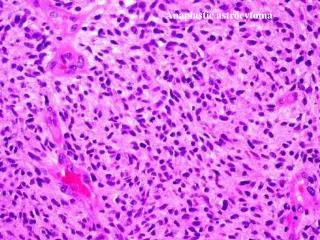
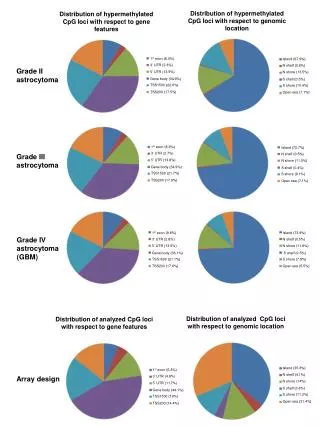
This study investigates the distribution of hypermethylated CpG loci in Grade II, III, and IV astrocytomas (GBM), specifically analyzing their genomic locations and relation to gene features. The findings reveal significant hypermethylation in regions such as gene bodies, TSS1500, and open sea areas, with specific percentages indicating their prevalence. The research aims to provide insights into the epigenetic alterations associated with astrocytomas, enhancing our understanding of their molecular biology and potential therapeutic targets.

Distribution Patterns of Hypermethylated CpG Loci in Astrocytomas by Genomic Location
E N D
Presentation Transcript
Distribution of hypermethylatedCpG loci with respect to genomic location Distribution of hypermethylatedCpG loci with respect to gene features Grade II astrocytoma Island (35.6%) 1st exon (8.9%) Island (72.7%) 1st exon (8.4%) Island (67.9%) 1st exon (6.3%) 1st exon (9.8%) Island (73.8%) 3’ UTR (2.7%) N shelf (0.5%) N shelf (0.5%) 3’ UTR (2.3%) N shelf (0.6%) 3’ UTR (4.6%) 3’ UTR (2.8%) N shelf (4.1%) N shore (11.5%) 5’ UTR (11.7%) 5’ UTR (13.9%) N shore (11.8%) 5’ UTR (13.5%) N shore (14%) 5’ UTR (13.8%) N shore (13.5%) S shelf (0.4%) Gene body (44.1%) Gene body (34.9%) Gene body (36.1%) Gene body (34.9%) S shelf (0.5%) S shelf (0.5%) S shelf (3.6%) S shore (9.1%) TSS1500 (22.6%) TSS1500 (21.1%) S shore (11.2%) S shore (10.4%) TSS1500 (21.7%) S shore (7.9%) TSS1500 (19%) TSS200 (14.4%) Open sea (31.4%) Open sea (5.5%) Open sea (7.1%) Open sea (7.1%) TSS200 (17.9%) TSS200 (17.5%) TSS200 (17.6%) Grade III astrocytoma Grade IV astrocytoma (GBM) Distribution of analyzed CpG loci with respect to genomic location Distribution of analyzed CpG loci with respect to gene features Array design