Wireless Sensor Network for Structural Health Monitoring at Golden Gate Bridge
Monitor structure health using sensor network, analyze vibrations, deploy sensors with precision, ensure reliable data collection. Challenges overcome with advanced tech.

Wireless Sensor Network for Structural Health Monitoring at Golden Gate Bridge
E N D
Presentation Transcript
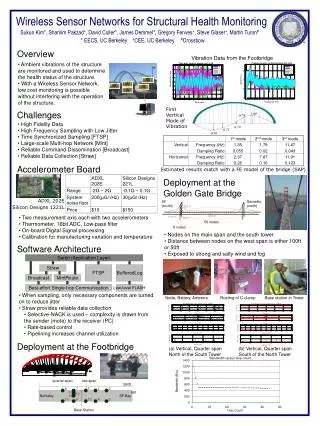
SF (south) Sausalito (north) 500 ft Time plot, vertical sensors at L1-L5 Frequency plot, vertical sensors at L1-L5 8 V2 4200 ft V2 V4 1125 ft 246 ft 6 V13 V4 V7 V13 4 56 nodes 10 4 V9 V7 V9 8 nodes 2 Acceleration (mg) 0 abs(FFT(.)) 2 10 -2 -4 0 10 -6 -8 0 1 2 3 4 5 6 7 8 9 10 -2 Time (sec) 10 0 2 4 6 8 10 12 14 16 18 20 Frequency (Hz) Sentri (Application Layer) Straw FTSP BufferedLog Broadcast MintRoute Best-effort Single-hop Communication Low-level FLASH ADXL 202E Silicon Designs 1221L 1.00 0.74 0.19 -0.73 -0.99 quarter-span mid-span 260ft 9 7 5 1 2 11 16ft 12 Berkeley 14 SF Bay 10 8 13 4 3 Base Station Wireless Sensor Networks for Structural Health Monitoring Sukun Kim*, Shamim Pakzad+, David Culler*, James Demmel*, Gregory Fenves+, Steve Glaser+, Martin Turon# * EECS, UC Berkeley +CEE, UC Berkeley #Crossbow Overview Vibration Data from the Footbridge • Ambient vibrations of the structure are monitored and used to determine the health status of the structure. • With a Wireless Sensor Network, low cost monitoring is possible without interfering with the operation of the structure. First Vertical Mode of Vibration Challenges • High Fidelity Data • High Frequency Sampling with Low Jitter • Time Synchronized Sampling [FTSP] • Large-scale Multi-hop Network [Mint] • Reliable Command Dissemination [Broadcast] • Reliable Data Collection [Straw] Accelerometer Board Estimated results match with a FE model of the bridge (SAP) Deployment at the Golden Gate Bridge • Two measurement axis each with two accelerometers • Thermometer, 16bit ADC, Low-pass filter • On-board Digital Signal processing • Calibration for manufacturing variation and temperature • Nodes on the main span and the south tower • Distance between nodes on the west span is either 100ft or 50ft • Exposed to strong and salty wind and fog Software Architecture • When sampling, only necessary components are turned on to reduce jitter • Straw provides reliable data collection • Selective-NACK is used – complexity is drawn from the sender (mote) to the receiver (PC) • Rate-based control • Pipelining increases channel utilization Node, Battery, Antenna Rusting of C-clamp Base station in Tower Deployment at the Footbridge • Vertical, Quarter span • North of the South Tower (b) Vertical, Quarter span South of the North Tower