Download
1 / 28
280 likes | 427 Vues
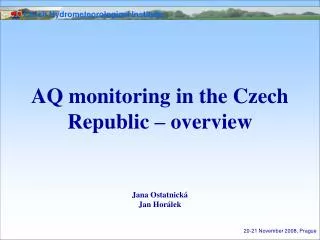
AQ monitoring in the Czech Republic – overview. Jana Ostatnická Jan Horálek. AQ monitoring in the Czech Republic.

E N D
AQ monitoring in the Czech Republic – overview Jana Ostatnická Jan Horálek 20-21 November 2008, Prague
AQ monitoring in the Czech Republic The Czech Hydrometeorological Institute (CHMI) is authorized by the Ministry of the Environment of the Czech Republic to monitor the pollutants’ concentrations in the ambient air and to assess air quality. It is also in charge of collection of data from the authorized monitoring networks of other organizations and their storage in the air pollution database which is the part of the Air Quality Information System of the Czech Republic (AQIS). 20-21 November 2008, Prague
The AQIS includes also databases of the chemical composition of precipitation and the emission databases. The databases of the Air Quality Information System are administered by the CHMI. 20-21 November 2008, Prague
The AQIS air pollution database and the database of chemical composition of precipitation receives and stores data from: • CHMI • Health Institute • the ČEZ company • Forest Management and Gamekeeping Research Institute (VÚLHM) • Czech Geological Survey (ČGS) • the Water Management Research Institute T.G.M. (VÚV) • the Hydrobiological Institute (HBÚ) • and from the stations of municipal authorities and other contributors. 20-21 November 2008, Prague
Since 1996 data for the German part of the former Black Triangle provided by Landesamt für Umwelt und Geologie in Dresden • Since 1997 data from the border area for the Polish part provided by Wojewodski Inspektorat Ochrony Srodowiska in Jelenia Gora • Data on the quality of atmospheric precipitation from Poland have been submitted since the second half of the 90’s by Instytut Meteorologii I Gospodarki Wodnej in Wroclaw. 20-21 November 2008, Prague
Major station networks of ambient air quality monitoring, 2007 20-21 November 2008, Prague
CHMI monitoring network The oldest data stored in the air pollution database include the SO2 concentrations measured by manual method in 1969. In those years mainly SO2 concentrations were measured in the northwestern area of the Czech Republic. In the 70’s and 80’s this area represented the most loaded territory in the Czech Republic, mainly due to high emissions from power plants. In 1971 the measurements of solid particles started and in 1973 NOx measurements were launched (manual methods). 20-21 November 2008, Prague
1984 – Automated stations (AMS), SO2, NOX 1992 – TSP 1994 – PM10 2004 – CHMI monitoring networks were reconstructed The number of measuring programs and the location of monitoring stations were carried out with regard to the aims of measurements set by the respective EU directives, the Clean Air Act No. 86/2002 Coll. on Clear Air Protection and Amendment of Some Other Acts, and the Government Order No. 597/2006 Coll. on air quality monitoring and assessment, in order to ensure ambient air quality monitoring on the whole territory of the Czech Republic and mainly in the areas with deteriorated air quality. 20-21 November 2008, Prague
Monitoring of SO2 in selected organisations – development 20-21 November 2008, Prague
Monitoring of TSP/PM10 in selected organisations – development 20-21 November 2008, Prague
Monitoring of NOx/NO2 in selected organisations – development 20-21 November 2008, Prague
CHMI monitoring networks, 2007 20-21 November 2008, Prague
Overview of measuring AMS • SO2,NO2, NOx, NO, PM10, PM2.5 • ozone • carbon monoxide • benzene and other aromatic hydrocarbons (toluene, etylbenzene, m,p-xylene, o-xylene) • other VOCs (2 lokalities) • supplementary meteorological elements 20-21 November 2008, Prague
Manual stations • SO2, NO2, NOx, PM10, PM2.5 • heavy metals (Cd, Ni, As, Pb, Mn, Cu) • POPs –benzo(a)pyrene above all • SO4, SNO3, SNH4 (3 lokalities) Several localities measure benzene with the use of passive samplers. 20-21 November 2008, Prague
The Air Quality Protection Division of the Czech Hydrometeorological Institute is located in Prague-Komořany and in five regional CHMI branches – in Ústí nad Labem, Ostrava, Hradec Králové, Brno and Plzeň. 20-21 November 2008, Prague
The branch offices ensure the operation and maintenance of the monitoring networks, both manual and automated, sampling and the transport of samples to the respective laboratories. The Central Laboratory works in Prague-Libuš, further laboratories are in the branch offices in Ústí nad Labem, Ostrava and Brno. 20-21 November 2008, Prague
The measured data from the automated CHMI stations(AMS) are supplied in 1-hour interval to the central AQIS database to Prague as operative data. Monthly summary of these data is verified in the respective branch office and sent off as a monthly batch to be stored in the air pollution database. Thus the operative data are replaced by the verified data. Operative data from the measurements of CHMI automated stations are available immediately on the CHMI website. 20-21 November 2008, Prague
Data from manual CHMI stations are analyzed in the laboratories and then transferred, mostly as monthly batches, to the AQIS database. Data measured in the monitoring network of other state organizations, stored in the AQIS air pollution database, are obtained from the suppliers mostly once in month. The measured data are submitted to the verification of 2nd level in the AQIS air pollution database. 20-21 November 2008, Prague
Quality control Within this control the unreliable data are detected from the currently stored national files of daily averages of air pollution data using the database application. The primary detection of unreliable data in the newly stored national files of daily averages of air pollution data is carried out by using the database application. The application is launched automatically upon each ISKO database update (i.e. input of new data, correction of the stored data etc.) and its output in the form of html page is given at disposal of the researcher responsible for the reliability control of the stored data. 20-21 November 2008, Prague
The researcher responsible for the control of data considers the results of verification and then contacts the data supplier and requests the verification of suspicious data and, if necessary, the approval to eliminate the data from the database. The supplier sends the corrected data to the ISKO data administrator who stores the corrected data to the database. 20-21 November 2008, Prague
Measured data processing After the collection of data for the period of one year the researcher responsible for the control of data accuracy carries out also the control of reliability of all measured and calculated (aggregated) air pollution data exceeding the limit values. After the measured data for the whole calendar year have been uploaded the aggregated data are calculated – annual, monthly averages, percentiles, and other air pollution characteristics linked with the limit values. First off the Tabular Yearbook is published, and later the data are processed in the output suitable for the assessment of ambient air quality for the respective previous year. 20-21 November 2008, Prague
The outputs mainly include the construction of spatial maps of individual air pollution characteristics for which the limit values have been set, both for health protection and ecosystem and vegetation protection, in GIS (annual average concentrations of PM10, NO2, 36th highest PM10 concentration in the given year etc.). Further, various overviews and graphical outputs and assessments are produced depicting ambient air quality in the previous year. The material is compiled in the so called Graphical Yearbook of CHMI. 20-21 November 2008, Prague
Field of annual average concentration of PM10 in 2007 20-21 November 2008, Prague
Field of the 36th highest 24-hour concentration of PM10 in 2007 20-21 November 2008, Prague
Trends of NO2, NOx in the Czech Republic, 1996–2007 20-21 November 2008, Prague
Trends of O3 in the Czech Republic, 1996–2007 20-21 November 2008, Prague
Trends of SO2in the Czech Republic, 1996–2007 20-21 November 2008, Prague
The processed information is used as the basis for other reports and reviews, mainly for the state administrative bodies and informing the general public, incl. the publication of the materials on web sites, e.g. for the Environment Report, the Statistical Yearbook and the Report on Monitoring. 20-21 November 2008, Prague