Download
1 / 15
150 likes | 185 Vues
Explore methods for estimating "Electroweak" and "QCD" backgrounds in a diphoton signal region, addressing limited control sample statistics. Consider new approaches and systematic errors, such as fake rates and HT sideband extrapolation.

E N D
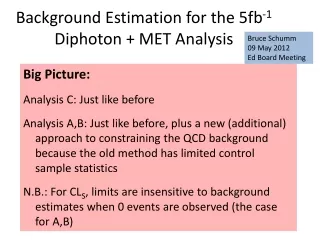
Background Estimation for the 5fb-1 Diphoton + MET Analysis Bruce Schumm 09 May 2012 Ed Board Meeting Big Picture: Analysis C: Just like before Analysis A,B: Just like before, plus a new (additional) approach to constraining the QCD background because the old method has limited control sample statistics N.B.: For CLS, limits are insensitive to background estimates when 0 events are observed (the case for A,B)
Two types of Background (not perfectly delineated): “Electroweak” or “Intrinsic MET” • MET from in W or ttbar events • Dominated (75%) by real photon + e fake • Estimate with e control sample & e fake rate “QCD” or “Instrumental” • Can be jet/jet, jet/, or real process • Estimate by matching MET shape from control sample to data in QCD-dominated low-MET region
BACKGROUNDS E- Control Sample (Penn) QCDg Control Sample (DESY) Overlap ? (DESY) Missed? (SCIPP)
Start by counting electron/photon events in bins of , to be scaled by the e fake rate (see below) Recall (MET,HT) cuts:
Fake photon can be reconstructed as converted (c) .OR. unconverted (u) photon (total is sum of the two) Fake rates: from Z e+e- sample; using “tag and probe” method. An alternative method sets systematic error range: • Uses medium v/ tight electrons • Includes 20 < pTe < 25 • Includes 0 < MET < 20
Product of the two yields the expected “electroweak” background in the diphoton signal region: A: 0.03 events B: 0.08 events C: 0.76 events
to this Scale this Scale factor is ratio N/Ncontrol for 0 < MET < 20 Background estimate; size of scale factor sets degree of statistical relevance of estimate MET = 125 To get this QCD Background (e.g. C Analysis)
But the problem is… A B 0 control events! (Signal HT, , MET cuts applied to control sample) Not a problem in and of itself (background-free is good!) but scale factors are small (~2:1) Somewhat weak constraints for A, B analyses
68% CL for Control sample with nominal cut IDEA What happens if we increase statistics of control sample by relaxing HT cut? Remember: still scale to same sample Concern: MET shape might change Remedy: Extrapolate parabola to nominal HT cut, treat as independent constraint relative to that of nominal HT cut from last page
How to make use of this information? Current note: Direct constrain (0) is conservatively low Parabolic constrain (0.14, 0.54 for A,B) is conservatively high • Take average, with 100% error
Possible Alternative: Take statistical average of • 0 68%CL and • parabolic fit result with associated statistical error • not perfect, but should give reasonable constraint Note: Parabola is not overconstrained, so use errors on linear fit instead.
Other Systematics • MET dependence (“template”) from QCD vs. Z e+e- • Choice of normalization region for QCD background • Fake-rate systematic • 25% of EW background that is not from e (most probably incorporated in QCD background) • Subtraction of QCD contribution to EW background estimate (almost negliglble)
WRAP-UP Background estimation techniques are direct generalizations of prior techniques to new analsysis regions (A,B,C) Because of limited statistics of the QCD control samples, an HT sideband extrapolation technique was developed to provide additional information for A,B analyses A, B background estimates have no effect on limits (0 observed events), but confirm that analyses are essentially background-free. Need to agree on how to present this in the note. C analysis techniques truly identical to last time, but more careful selection reduced background by x5 or so.
Start by counting electron/photon events in bins of , to be scaled by the e fake rate (see below) Recall (MET,HT) cuts: A (200,600) GeV B (100,1100) Gev C (125,0) GeV
Start by counting electron/photon events in bins of , to be scaled by the e fake rate (see below) Recall (MET,HT) cuts: A (200,600) GeV B (100,1100) Gev C (125,0) GeV