Download
1 / 35
350 likes | 485 Vues
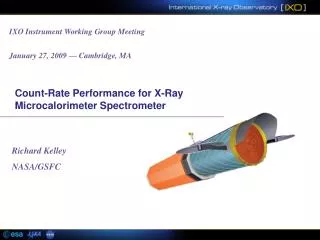
X-Ray Measurements Using a Microcalorimeter on an Electron Beam Ion Trap E. Silver, N.S. Brickhouse and H. Schnopper Harvard-Smithsonian Center for Astrophysics G.X. Chen and K. Kirby Institute for Theoretical Atomic and Molecular Physics J.D. Gillaspy, J. N. Tan, J. M. Pomeroy

E N D
X-Ray Measurements Using a Microcalorimeter on an Electron Beam Ion Trap E. Silver, N.S. Brickhouse and H. Schnopper Harvard-Smithsonian Center for Astrophysics G.X. Chen and K. Kirby Institute for Theoretical Atomic and Molecular Physics J.D. Gillaspy, J. N. Tan, J. M. Pomeroy National Institute of Standards and Technology J. M. Laming Center for Space Science, US Naval Research Laboratory High Accuracy Atomic Physics in Astronomy August 7–9 , 2006
● Microcalorimeters Are No Longer a Laboratory Curiosity! • X-ray astronomy (SAO,GSFC,U of WI, NIST (B), OAPA) • Laboratory astrophysics (SAO,NIST(G), LLNL, GSFC, OAPA) • Materials science (SAO, NIST(B), LLNL) • Particle astrophysics (U of Cal, LBNL) • Surface physics (SAO, NIST (G)) • Heavy ion spectroscopy (SAO, GSI, U of WI, GSFC) • Mass spectroscopy (LLNL) • Biological analysis (SAO) • ● Briefly explain why these detectors represent such a discontinuous jump in performance • Highlight a range of EBIT measurements • Present our latest theoretical and experimental work on neon-like Fe and Ni • Discuss how to tackle important issues to improve measurement accuracy
Microcalorimeter Thermometer X-ray Temperature Absorber Weak thermal link (Aluminum Wires) Heat Sink
Microcalorimeter Tin Absorber NTD Thermistor Aluminum Wires Require small C Low T Low noise readout Heat Sink Goal Measure < femtojoule (10-15 joules) With precision of 1 part in 1000 (atojoule) Over dynamic range > 100
SEM micrograph of single pixel NTD-Ge microcalorimeter with Sn absorber Temperature X-ray NTD Thermistor Sn Absorber Weak thermal link (Aluminum Wires) Heat Sink FeedbackResistor Voltage Current Source Signal: DV = DI RF Bypass Capacitor JFET Thermistor V constant, DR Resistivity vs T-1/2 for samples of NTD Ge available for thermistor use
Soft X-Ray Performance 0.35 mm x 0.35 mm x 7 m tin absorber + NTD 17 Ge thermistor
The Conventional Electron Beam Ion Trap (EBIT) • The EBIT was invented in 1988 ago by Mort Levine at LBNL • The first EBITs were built in the US, first at LLNL, then at NIST • Today there are machines in the UK, Germany, and Japan • soon there will be one at CfA ! • Spectral lines are emitted by multiply charged ions, which are created and trapped under well controlled conditions • Every charge-state of every astrophysically important element can be created • Conditions are very similar to the plasmas of the solar corona
Capabilities … Ions at rest … electrons with nearly constant energy … fast switching of voltages • Selection of specific charge states • Simulating specific slices of astrophysical conditions • Measurements of atomic data of elementary processes • electron impact ionization-, and excitation cross sections • radiative- and dielectronic recombination processes • excited state lifetimes • charge exchange cross sections • precision x-ray wavelengths • X-ray polarization measurements
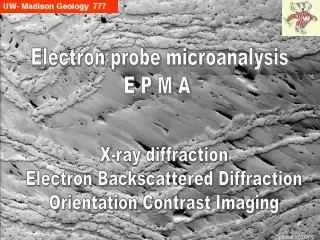
Ion Beam Extraction For Surface Physics Extracted Ions Ion Surface Interactions Electron Capture into High n-states forms Hollow Atoms • NIST Group • R. Schuch • University of Stockholm • D. Schneider • LLNL EBIT Microcalorimeter
Spectroscopy of Trapped Ions in an Electron Beam Ion Trap He-like and H-like N and O He-like Ne Silver et al., ApJ 541 (2000) 495. Ne-like Fe XVII Laming et al., (2000), Ap.J., 545, L161.
Heat Exchangers Liquid He 4 K 180 K 90 K ADR and Detectors Windows Cryostat with 2-Stage ADR EBIT X-ray beamline Microcalorimeter inside EM shield 1 x 4 pixel NTD Ge array Detectors kept at temperature of 60 mK +/- 1 K rms for 52 hours) Windows: 4 x (800 Å polyimide, 500 Å aluminum) Built-in x-ray tube for calibration SAO-NIST NTD Microcalorimeter EBIT SET-UP
Sample of measurements using new microcalorimeter at NIST Ne-like Fe XVII Broad band measurements of He-like Argon
Status of neon-like FeXVII and Ni XIX as a Diagnostic For Astrophysical Plasmas EBIT Measurements FeXVII produces some of the strongest lines observed in astrophysical and solar X-ray observations. Its diagnostic capability, however, has been limited because the line formation mechanism is not well known and early spectral modeling codes had large uncertainties. In many instances the ratio of R1=3C/3Dwas frequently much lower than predicted by theory. The ratio of complete 3s to complete 3d transitions is also frequently larger than predicted by theory. This has been an ongoing challenge to theory. C G F M2 D E Active Binary HR1099 as observed by CHANDRA HETG
Some Recent Papers on Fe XVII Brown, 1998 (crystal) Ap. J. 502, 1015 (1998); see also 532, 1245 (2000). Laming, et al 2000 (microcalorimeter) Ap. J. 545, L161 (2000). Brown 2001 (crystal) Phys. Rev. A 63, 032719 (2001). Beiersdorfer 2002 (crystal & microcalorimeter) Astrophys. J. 576, L169 (2002). Chen and Pradhan 2002 (theory) Phys. Rev. Lett. 89, 013202-1 (2002). Gillaspy 2004 (microcalorimeter) CP730 (AIP, New York) 245 (2004). Chen and Pradhan (preprint; theory) Fournier and Hanson 2005 (theory) Phys. Rev. A 71, 012717 (2005). Loch, et al 2006 (theory) J. Phys. B 39, 85 (2006). An ongoing saga!
THE PROBLEM Agreement between NIST and LLNL measurements is not satisfactory Neither NIST nor LLNL measurements agreed with early theory.
First, a look at the discrepancy with theory. . . The interpretation of experimental and observational ratios of line intensities has usually relied on collisional-radiative (CR) models such as those using theoretical cross-sections that neglect the fundamental role of resonant excitation. Resonant excitation preferentially affects the forbidden and intercombination transitions as opposed to dipole allowed ones. While the 3C (λλ=15.014 Å) line is dipole allowed, the 3D (λλ=15.265 Å) and 3E (λλ=15.456 Å) are spin-forbidden intercombination transitions. The majority of calculations to date has used the distorted wave (DW) approximation that neglects channel coupling and hence, resonances. Figure from Beiersdorfer, 2003 (review) Chen & Pradhan, 2002
Pradhan and Chen’s calculations are perhaps the largest scale e-ion scattering calculations to date (for any system). • Dimension of Hamiltonian=10286 • 89 level eigenfunction expansion • 395 free channels • 486 bound channels • 20,000 energy points on grid
Resonances are a key part of the Chen & Pradhan (2002) calculation--they result in oscillations as a function of energy. Intercombination (spin-forbidden) line 3E Close coupling calculation of excitation collision strengths in black <4% change in beam energy changes result by 50% Green line = EBIT 30 eV beam width Blue dots=Distorted wave.
Chen and Pradhan: “Excellent agreement with two independent measurements on electron beam ion traps” LLNL NIST There is even a suggestion that some of the differences between the the experimental measurements may be accounted for.
3.2 3.0 2.8 2.6 2.4 900 1000 1100 1200 1300 LLNL (Microcalorimeter) A Closer look. . . (two voices): Pradhan and Chen: everything is fine LLNL: there is a big discrepancy LLNL Crystal C/D NIST-SAO Microcalorimeter E-beam energy (eV) At low energy, LLNL<NIST (average reported as greater than)
Evidence for Convergence of Theory and Experiments for the 3C/3D line intensity ratio in neon-like Ni XIX with new data from NIST EBIT + SAO microcalorimeter The line ratios are not a universal constant in an optically thin plasma excited by electron impact (Chen and Pradhan) Rather: they depend on both the characteristic electron energy (temperature) and the detailed distribution of the electron energies about that characteristic value. NIST EBIT + SAO microcalorimeter measurements separated by about six months, and using two different electron gun. From Chen et al, 2006; submitted to PRL.
R-matrix with Maxwellian average – solid black; R-matrix with Gaussian average (30 eV) – solid red Filled Green – LLNL EBIT; Open Green – NIST EBIT Open red circles – Solar (T~ 4MK); Open blue – Capella (Chandra); Filled Blue – Solar (XMM Newton). Extreme left – other measurements From Chen and Pradhan 2002, preprint SAO-NIST (Laming et al. 2000) Accurate measurements of beam widths are crucial. The electron distribution function (EDF) in turn, bears on physical effects such as space charge potential, beam currents, polarization corrections, etc. Nevertheless, the theoretical sets of 3s/3d ratios clearly demonstrate that they are sensitive to the plasma conditions, i.e., these are source-specific
Summary of recent theoretical progress stimulated by EBIT data: • Resonances are significant. • C/D and s/d are temperature dependent. • No arbitrary adjustment of cross sections. • Energy distribution may reconcile experiments.
Issues to confront in future measurements Counting statistics: The improved MEVVA and extended hold time will contribute to more efficient data collection. The Ni XIX measurement is an example of the statistical quality that can be obtained in 3.75 hours of integration. Energy dependence: Accurately measure the width of the electron energy distribution as a function of beam energy. In our Ni XIX experiment, a small amount of nitrogen gas was injected to provide evaporative cooling of the Ni ions, which allowed us to observe the location and width of radiative recombination (RR) lines onto bare and hydrogen-like nitrogen ions in the trap. This data provided a value for the beam width at high energy (1347 eV), but the uncertainties were large at the lowest energy (1000 eV) where there were several overlapping lines. More statistics are needed at the low energies. Charge purity and collisional equilibrium: Gas injection pressure can strongly influence the relative charge state distribution in equilibrium as a function of electron beam energy Presence of lower charge states of Fe that overlap with FeXVII lines can indirectly influence the line ratios Studying the line ratios as a function of gas pressure Use time-resolved data acquisition to remove photons emitted by low charge states in the early stages of the ionization process. Polarization and quantization axis corrections: Polarized light is not emitted isotropically from the EBIT. The line intensity is determined by the ensemble of electron pitch angles with respect to the EBIT magnetic field These details can be measured and/or modeled. It has been our practice to publish the measured line intensities and use the theory and/or models to predict the effects on the line intensities by bracketing the results with unpolarized and 100% polarized values (see Laming et al.)
Heat Exchangers Liquid He 4 K 180 K 90 K ADR and Detectors Windows Window transmission: Four windows allow X-rays to pass through the thermal shields on their way to the microcalorimeter. The LLNL and NIST C/D ratios are in relatively good agreement (and relatively insensitive to window corrections due to the small energy difference between these lines). The 3s/3d ratios, however, strongly depend on these corrections. During the last 6 months, we have designed and built a unique X-ray spectroscopy monitor to measure the transmission efficiencies of the windows while they are cold and the cryostat is connected to the EBIT for experimentation This monitor spectrometer will not only provide an accurate measure of the transmission to better than 10%, but it will signal any changes with time. Cryostat X-Rays
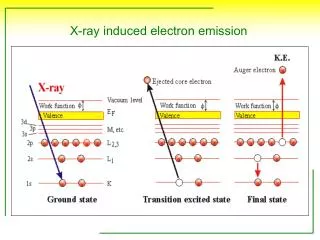
Instrumentation For Measuring The Efficiency of the Microcalorimeter In-Situ TOP VIEW The X-rays produced in the X-ray tube fluoresce emission lines of C Kα (277 eV, O Kα (525 eV), F Kα (677 eV), Cu Lα (929 eV), Al Kα (1487 eV) in a target that can be moved in and out of the beam line. These fluorescent X-rays are detected by the absolutely calibrated Si(Li) detector * and the microcalorimeter. Both detectors view the X-ray targets at the same angle. The intensity differences between the two detectors for each energy are due to the respective solid angles subtended by the detectors at the target and the total efficiencies of the two detectors. (The total efficiency includes the transmission of windows and the absorption properties of the detector elements). Since the total efficiency of this particular Si(Li) detector is known and the solid angles are measured, the total efficiency of the microcalorimeter (window transmissions + detector absorption) can be obtained routinely. * Detector properties determined by Gresham Scientific and verified through measurements at SAO.
First Test of Window Calibration Apparatus in a Lab Cryostat
Ion Surface Interactions Electron Capture into High n-states forms Hollow Atoms Cryostat vacuum wall 77 K 2 K Ion beam 60 mK microcalorimeter Polyimide windows Decay Dynamics Depends on velocity of ions Slow ions Auger, x-ray, UV transitions before reaching surface Fast ions Bulk interactions beneath surface Silver, E., et al., 2002, ICPEAC, XXII International Conference on Photonic, Electronic, and Atomic Collisions , Rinton Press, 312.
HEAT CAPACITY Dielectric Crystal m= mass of absorber; M = molecular weight; ΘD = Debye temperature Normal Metals Dominated by linearly decreasing specific heat of conduction electrons Superconductors Tc= transition temperature Limits : electron-phonon decoupling slows thermalization at lowest T need for high absorption efficiency
Cryostat with 2-Stage ADR • Detectors kept at temperature of 60 mK within 5 mK • Pressure = 10-7 torr • Windows: 800 Å polyimide, 500 Å aluminum Heat Exchangers Liquid He 4 K 180 K 90 K ADR and Detectors Windows