Download
1 / 57
570 likes | 705 Vues
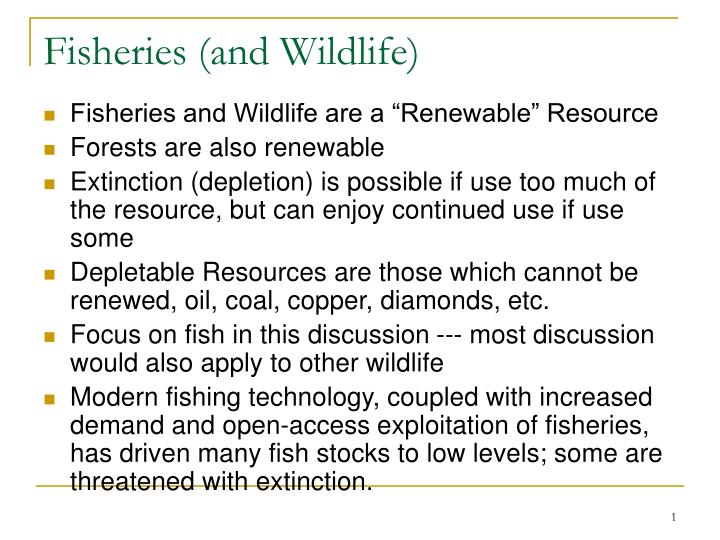
Fisheries (and Wildlife). Fisheries and Wildlife are a “Renewable” Resource Forests are also renewable Extinction (depletion) is possible if use too much of the resource, but can enjoy continued use if use some

E N D
Fisheries (and Wildlife) • Fisheries and Wildlife are a “Renewable” Resource • Forests are also renewable • Extinction (depletion) is possible if use too much of the resource, but can enjoy continued use if use some • Depletable Resources are those which cannot be renewed, oil, coal, copper, diamonds, etc. • Focus on fish in this discussion --- most discussion would also apply to other wildlife • Modern fishing technology, coupled with increased demand and open-access exploitation of fisheries, has driven many fish stocks to low levels; some are threatened with extinction.
Collapse: End of Global Fish Stock by 2050? (source: Globalization 101.org, the Levin Institute) • According Food and Agriculture Organization (FAO), over 70 percent of fish species are currently in danger of collapse. Monitoring 600 groups of fish species, the FAO deems 52 percent to be fully exploited, 17 percent overexploited, 7 percent depleted, and 1 percent recovering.
Collapse: End of Global Fish Stock by 2050? (source: Globalization 101.org, the Levin Institute) • Study published in Science using historical analysis projects the collapse of all fish stocks worldwide by 2048. • The four-year study was conducted by ecologists and economists at the National Center of Ecological Analysis and Synthesis, UCSB. • Scientists examined fish catch reports from 1950-2003 for 64 ocean-wide regions that represented 83 percent of fish species in the world. The biodiversity of 48 marine reserves and areas near fishing grounds were then examined. • The results show that the “collapse”, a decline of over 90 percent of stock, of one fish species can threaten an entire marine system. The reduction of biodiversity impairs an ecosystem’s ability to recover from environmental stresses and promotes instability.
US NOAA – Fish Stock Sustainability Index • Overfishing – Harvest rate is above a prescribed fishing mortality threshold. • Overfished - Stock size is below a prescribed biomass threshold. • Approaching Overfished Condition - Based on trends in harvesting effort, fishery resource size, and other appropriate factors, it is estimated that the fishery will become overfished within 2 years. • MSY - Maximum Sustainable Yield - The largest long-term average catch or yield that can be taken from a stock or stock complex under prevailing ecological and environmental conditions.
US Recreational Fishing • Recreational fishing is also very important in the United States. • According to the U.S. Fish and Wildlife Service, approximately 34 million adult Americans (over age 16) participated in recreational fishing in 2001. • These anglers accounted for 500,000 days of fishing and $35 billion on fishing-related expenses.
Fisheries Biology • The reproductive potential of a fish population is a function of both the size of the fish population and the characteristics of its habitat. • Both the growth of the population and the population itself are measured in biomass (weight) units. • Biomass does not distinguish between number of individuals and mass of individuals. • Figure 11.1 depicts a logistic growth function which illustrates the relationship between the fish population and the growth rate of the population. • Initially, there is no growth, then over some range of population (up to X2), population growth is increasing. Beyond X2, the growth of the population is decreasing.
Fisheries Biology • The ecosystem's ability to support the fish population is the most significant reason for the changing relationship between population growth and population. • With a low population, the resources will support increasing growth. • As the population grows, there is a growing competition for those resources and the growth in the population slows. • Eventually, the amount of growth falls to zero, which occurs at the maximum population K. • This point is also referred to as the carrying capacity of the environment and is a biological equilibrium.
Fisheries Biology • The growth function represented in Figure 11.1 represents a a compensated growth function. • Figure 11.2 contains a depensated growth function, where the growth rate initially increases and then decreases. • Figure 11.3 contains a critically depensated growth function where, X0 represents the minimum viable population. • If population falls below this level, growth becomes negative and population becomes irreversibly headed towards zero. • The implication is that if managers make a mistake and allow too much harvest, they may doom the population to extinction.
The Optimal Harvest • In order to determine how harvesting affects a fish population, consider the growth function in Figure 11.4. • Note that C1 represents the level of harvest (harvest and growth are measured on the vertical axis). • When a harvest of C1 units per year is removed from the fishery, the fish population declines because harvesting is removing a portion of the population. • Population will continue to fall until natural growth is equal to the harvest, which occurs at X1.
The Optimal Harvest • In Figure 11.5 a harvest level of C1 is associated with two equilibrium populations (X1' and X1"). • This means that growth is exactly equal to harvest and the population will remain unchanged at either of these levels. • Cmsy represents the harvest level associated with maximum sustainable yield for the fishery. • This is the only harvest level associated with one equilibrium point.
The Optimal Harvest • In the early discussions of fishery management, maximum sustainable yield was the theoretical goal of management policies. • Recent policy targets a more precautionary goal of a population between the carrying capacity and the level associated with maximum sustainable yield.
The Gordon Model and Its Evolution • In a 1955 article, H. Scott Gordon made the point that uncontrolled access to fishery resources would result in a greater than optimal level of fishing effort. • Gordon derived a catch function that represented a "bionomic" equilibrium. • This catch function considered the relationship between fishing effort, catch, and fish population. • Gordon’s analysis began by assuming that, holding everything else constant, catch is proportional to the fish population. • Figure 11.6 illustrates a set of yield functions, where each curve represents a different level of fishing effort.
The Gordon Model and Its Evolution • By superimposing the equilibrium catch function on the yield functions (Figure 11.7) it is possible to identify the effort and yield function associated with maximum sustainable yield in the fishery. • This is known as the sustainable yield function (Figure 11.8). • Notice the sustainable yield function examines the relationship between effort and catch. • As effort increases, sustainable yield increases and then decreases.
The Gordon Model and Its Evolution • A sustainable total revenue function can be derived from a sustainable yield function. • Price is assumed to be constant, based on the additional assumption that catch from that particular population will be small relative to the total market. • Given a constant price, a sustainable total revenue function can be derived simply by rescaling Figure 11.8. • In Figure 11.9, the sustainable total revenue function is labeled TR and an additional curve representing total costs (TC) is also given.
Efficient use of the fishery • Economic goal is to maximize net benefits (also called economic rent) • This occurs where NB = TR-TC is the greatest (also where MR=MC). • Economic rent originates from the productivity of the fish stock, where more fish implies greater catch with less effort (cost). • Where is economically efficient level of effort and harvest?
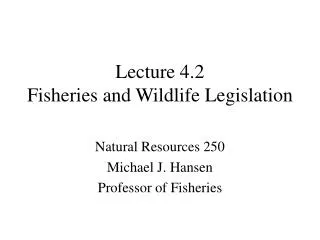
Efficient use of the fishery $ benefits, costs TC =cE E* EMSY Effort
Economic Efficiency • Assumptions in diagram • Price of fishing is fixed and constant • Cost of effort (c) is fixed and constant • Catch/unit effort increases with larger population • Optimal effort, that effort which maximizes economic rent, occurs at E* • How does efficiency compare to MSY? Smaller harvest and larger fish population • Why? Because higher fish population means lower cost/unit effort, when consider both costs and benefits, efficient to use less than MSY
Economic Efficiency • Extra benefit of fishing not worth extra effort past E* so more conservation than MSY • This is economically efficient level, will private market achieve this result? • Suppose there is a single owner of the fishery (not a monopoly, i.e., competes with other fisheries for price of fish, but only 1 decision maker concerning how much to fish this location) • What E will a single owner choose to maximize profits?
Single Owner solution • Profits = total revenue – total costs = pE – cE, same as net benefits • Can also see this in MR and MC curves (MC=c, shape of MR comes from TR curve) • Table 11.2 illustrates the relationship between total catch, marginal catch, and average catch. • Profits are maximized when MR = MC
Economic Efficiency, Open Access • Single owner would choose economically efficient level, will open access? • Open access = everyone can access the fishery, • Common property = everyone within a subset of the population can access the fishery (open access, but only to a subset of the population)
Solution under Open Access • In an open-access fishery, when economic rent is earned in the fishery, entrance by new firms occurs until economic rent falls to zero, effort level of E1 in Figure 11.9. • The entrance of firms in response to economic rent and the resulting increase in effort to E1 results in AR = MC rather than the optimal effort level of E2 where MR=MC. • Open access results in over exploitation of the resource • Total profits from fishery are reduced compared to single owner, more effort than necessary is being expended to get a given harvest
Overexploitation and Open Access • Each individual fisher compares their average catch and associated revenue with the value of the highest alternative to fishing. • If the highest alternative available is $50 per day, then the fisher will compare average catch (AP) multiplied by Price against the alternative of $50. • The result is that there are a greater number of fishers in the fishery than would be if the decision to enter was based on a comparison of marginal product* Price, rather than average product* Price.
How to get efficient solution? • Privatize Fishery --- often hard to do, not popular with many • Impost tax on effort --- would work, but not done much • Raise real cost of fishing ---- common, but not efficient, end up using more resources to catch same number of fish • Gear restrictions • Shorten season • Close certain fisheries,
Current Fishery Policy • Example of gear restriction, in Maryland's share of the Chesapeake, it is illegal to dredge for oysters under motorized power. This means sails, smaller dredging equipment, and slower movement across the oyster beds. • Regulation which revolves around restrictions on the minimum size of fish that are legal to harvest are designed to leave a portion of the fish stock in the water to provide a sufficient breeding stock to ensure future populations. • Fishers generally implement this restriction by choosing a mesh size for their nets that allows smaller, illegal fish, to escape. • Because fishing activity may disrupt the spawning process, often the fishing season is closed for a certain period on an annual basis, generally during spawning season. • Also, some species become so extremely congregated during spawning that fishing effort could capture virtually the entire population.
Current Fishing Policy • Regulations on where fish may be caught are designed to protect fish stocks when they are congregated and vulnerable to overharvesting. • These types of regulations also protect vulnerable fishing habitats from destruction by the fishing process. • There can be limits on how many fish may be captured in a given time period. • These limits may be in the form of weight caught, number of fish, or volume of catch. • Example, the catch limit on giant bluefin tuna is 1 fish per boat. A fish can often weigh as much as 1000 pounds and the market price has been $18 per pound.
Individual transferable quotas • Individual transferable quotas (ITQs) would work in a fashion similar to marketable pollution permits. • By limiting the number of catch quota which are issued, bidding for the quotas will occur until the price of the quota is exactly equal to the divergence between average cost and price (average rent). • Limited entry techniques structured to direct effort rather than catch can also be developed. • Here only a fixed number of boats would be allowed to operate in the fishery. • The method of permit allocation could be by auction or historical presence in the fishery.
Limited Entry Techniques • If these ITQs are transferable, it will be possible to have only the most efficient fisherman in the fishery. • Enforcement of effort-based limits, that is vessel permits, would be much easier than that associated with the catch limits. • No measuring or weighing is necessary; a poster sized certificate of operation would allow easy identification of legal vessels. • Catch-based ITQs are subject to several problems. • People might cheat on their quota by selling to foreign vessels or in an underground market. • Another problem is associated with the differing market values of different size fish.
Limited Entry Techniques • Although most fishery regulation relies on open-access techniques, an important example of a limited entry technique is the Virginia oyster fishery, where oyster beds are treated as private property. • It gives oyster bed operators incentive to invest in their property such as seeding with larval oysters and creating more structures to which the oysters can attach. • An additional example of the limited entry regulation is the economic exclusion zone, established under the authority of the United Nations Convention of the Law of the Sea. • This regulation established a 200 mile limit along the coast of a country where each country has the right to limit access to their waters. This is a partial limited access regulation.
Other Issues in Fishery Management • Other problems associated with fishery management include: • incidental catch; • destruction of habitat through fishing activities; • destruction of wetlands and related habitat through non-fishing activities; • pollution of fishery habitat; • conflicts between user groups and • international cooperation concerning the harvesting of migratory species.
Aquaculture • Aquaculture, the cultivation of fish in artificial environments or in contained natural environments, is often suggested as a means of dealing with the open-access problem. • Not all species can be cultivated. • Shellfish are ideal because of their inherent immobility. • Wildfish will benefit indirectly from aquaculture if the "farmed" species usurps part of the market demand for the wildfish and therefore reduces the fishing pressure on the species. • Aquaculture creates its own set of problems.
Aquaculture • Aquaculture can damage the environment, • e.g., Shrimp aquaculture in Central and South America has resulted in a loss of mangrove forests, excess nutrient loading into estuaries and severely reduced dissolved oxygen in areas bordering estuaries. • There are also potential problems associated with hybridized fish escaping and damaging the gene pool of existing species.
Gill Nets and Long Lines • Often the fisher will catch not only the species that they seek but also other species, referred to as incidental catch. • Many types of fishing gear do not discriminate among fish species, and both the desired species and a spectrum of untargeted species are caught by this gear. • Among the most notorious of these are the gill nets, whose lengths often measured in miles. • These nets are vertically suspended in the water, like underwater fences, ensnaring the gill covers of fish as they attempt to back out.
Gill Nets and Long Lines • Another indiscriminate fishing method is "long-lining." • A long-line consists of line that may be 10 kilometers in length or longer, with baited hooks every several meters. • These lines are employed off the Atlantic coast in pursuit of highly profitable swordfish. • Because sharks are often caught, these long-lines have been an important factor in the decline of the shark populations.