Download
1 / 27
270 likes | 380 Vues
ARCVIEW. ArcView Basics Garth Hudson Mary Veinotte. The ArcView GUI. Menus, Buttons, Tools Document Types Active vs. Visible Themes. Menus, Buttons, Tools. Menu Bar : Contains ArcView pull-down menus grouped by function type.

E N D
ARCVIEW ArcView BasicsGarth HudsonMary Veinotte ESRI Canada - GIS in Education
The ArcView GUI Menus, Buttons, Tools Document Types Active vs. Visible Themes ESRI Canada - GIS in Education
Menus, Buttons, Tools Menu Bar: Contains ArcView pull-down menus grouped by function type. Window Title Bar: Use to select a window and move windows around the screen Tool Bar: Click a tool and it becomes active (pushed in). Apply the tool inside a document to execute the function. Button Bar: Contains ArcView command buttons. Click a button once to execute a function. Tool Tips: Hold the mouse pointer over a Button or Tool to get its name. Also look in the Status Bar ESRI Canada - GIS in Education
ArcView Project Window • A Project is a file that organizes all the information you need to do your work. • It lists the icons for ArcView’s five main documents. You open, print or create documents using these buttons. Your documents are listed here. Choose a document type from these icons. ESRI Canada - GIS in Education
ArcView Documents • Views - Contain the map data or Themes. • Tables - Tables show the attribute data attached to your map data. • Charts - These are Chart and Graph displays of your data. • Layouts - Layouts are where you assemble your map for printing - it’s your final printed page. • Scripts - These are used to enter Avenue code to customize ArcView. ESRI Canada - GIS in Education
The View Document • Document where your working map is displayed. • You can: • pan and zoom • create and edit features • perform queries • and more… ESRI Canada - GIS in Education
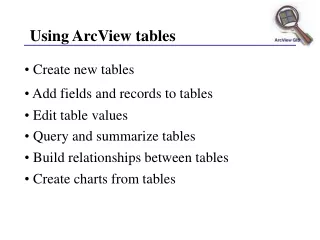
The Table Document • Contains all the table manipulation controls. • Manipulate, edit or create attribute data. • You can: • join tables • perform queries • summarize statistics • and more… ESRI Canada - GIS in Education
The Chart Document • This document displays tabular data graphically. • Charts are dynamically linked to tables and views. ESRI Canada - GIS in Education
The Layout Document • Assemble all components of your project for printing. • You can: • insert frames for views, tables, charts • add a scale bar and north arrow ESRI Canada - GIS in Education
The Script Document • This where you can write Avenue scripts that will allow you to customize ArcView. • Some functions in ArcView are accessible through the script document. • Mostly for advanced users. ESRI Canada - GIS in Education
ArcView - The “Active” GIS • The “Active” Document: • Document window that you are currently working with (View, Table…) • The menus, buttons, and tools will look different with each document. • Make documents “active” by: • Single-click on the document window • Choose document name from Window menu ESRI Canada - GIS in Education
ArcView - The “Active” GIS • The “Active” Theme: • Not to be confused with “Visible” • Before you work with a theme, it needs to be “active”. • Some tools only work with “active” themes (e.g.. Identify tool). Active Not Active Visible Not Visible ESRI Canada - GIS in Education
Setting Theme Status • Setting Visible or Active Status: • To make a theme “Visible”, single-click on the Visibility Selector • To make a theme “Active”, single-click on the Theme Name Window Title Bar Visibility Selector Theme Name View Area (map) Table of Contents ESRI Canada - GIS in Education
ArcView Functions Data Manipulation Data Analysis Data Presentation Customization ESRI Canada - GIS in Education
Manipulation Analysis Presentation Data Creation • Table Digitizing traces objects on a paper map • Uses a digitizing tablet • Heads-up Digitizing traces objects on the screen • Scanned map, air photo or satellite image ESRI Canada - GIS in Education
Manipulation Analysis Presentation Data Editing • Data stored in tables (spreadsheets) • Tables composed of Records • Records composed of Fields • New tables can be created, and data added and changed... ESRI Canada - GIS in Education
Manipulation Analysis Presentation Event Mapping • Tables often contain location information. This can be converted to points. ESRI Canada - GIS in Education
Manipulation Analysis Presentation Address Matching • Matches address data to streets to create points. ESRI Canada - GIS in Education
Manipulation Analysis Presentation Table Query • ArcView can answer questions about the attribute data... • How many countries will have a population of more than 30 million in the year 2000? ESRI Canada - GIS in Education
Manipulation Analysis Presentation Joining Tables • Some data is stored external databases • To be used by a GIS, these tables must be joined to a map. ESRI Canada - GIS in Education
Manipulation Analysis Presentation Spatial Query • ArcView can answer questions about the location of entities... • How many customers live within 500m of a highway? ESRI Canada - GIS in Education
Manipulation Analysis Presentation Thematic Maps • ArcView supports thematic mapping... Graduated Colour Chart Maps ESRI Canada - GIS in Education
Manipulation Analysis Presentation Graphs / Charts • ArcView can also produce traditional charts and graphs based on map data... Pie Chart ESRI Canada - GIS in Education
Manipulation Analysis Presentation Map Design • Bring everything together in a Layout... Legend Map Views North Arrow Text Scale Bar Graphs ESRI Canada - GIS in Education
Manipulation Analysis Presentation Hot-Linking • Objects on map can be “Hot-Linked” to other applications... ESRI Canada - GIS in Education
Customization • ArcView GIS includes Avenue™ • Avenue is a true Object-Oriented Programming language • ArcView’s Graphical User Interface (GUI) can be fully customized ESRI Canada - GIS in Education