Research on Human Behaviour Simulation in the Built Environment
490 likes | 705 Vues
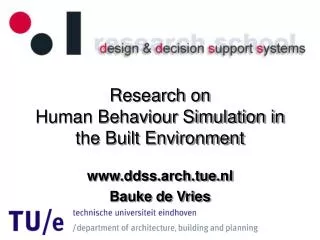
Research on Human Behaviour Simulation in the Built Environment. www.ddss.arch.tue.nl Bauke de Vries. Programme. Who am I / Where do I come from Research programma Design and Decision Support System PhD and Graduation projects on Behaviour Simulation in the Built Environment. Who am I.

Research on Human Behaviour Simulation in the Built Environment
E N D
Presentation Transcript
Research onHuman Behaviour Simulation inthe Built Environment www.ddss.arch.tue.nl Bauke de Vries
Programme • Who am I / Where do I come from • Research programma Design and Decision Support System • PhD and Graduation projects on Behaviour Simulation in the Built Environment
Who am I Name: Bauke de Vries Age: 49 Occupation: Married, 2 children Education: Msc in Architecture, Building and Planning, PhD at Eindhoven University of Technology (TU/e) Profession: Professor at TU/e in Design Systems
Where am I from Eindhoven University of Technology, founded by Philips 50 year ago Faculty Architecture, Building and Planning -1000 Bachelor students - 500 Master students - 50 PhD students
Research Programme:Design and Decison Support Systems DDSS Planning Design ICT Artificial Intelligence
EU and PhD projects • Building Management Simulation Centre • Decision Support System for Building Refurbishment • Measuring User Satisfaction through Virtual Environments • Using a Virtual Environment for Understanding Real-World Travel Behavior • A Learning Based Transportation Oriented Simulation Systems • Human Behavior Simulation in the Built Environment
Projects on Behaviour Simulation • VR experiments (Amy Tan) • Space utilisation (Vincent Tabak) • Pedestrian behavior (Jan Dijkstra) • AMANDA framework (Joran Jessurun) • Evacuation and smoke simulation (Martin Klein) • Safety assesment (Ruben Steins)
The Reliability and Validity of Interactive Virtual Reality Computer Experiments: SPIN System
SPIN: Demo (start CD-ROM)
The Reliability and Validity of Interactive Virtual Reality Computer Experiments: Conclusions • The structural dimensions (number of stops, number of activities) were better measured by SPIN. • The PAPI questionnaire yielded better responses for durations (of shopping activity, services activity, out-of-home leisure activity, travel between activities, whole schedule). • Route choice data indicated that SPIN was not able to measure this dimension better than PAPI.
User Simulation of Space Utilisation • Existing models focus on evacuation behaviour • Aim: Analyze the performance of a design through user behaviour simulation
System overview The User Simulation of Space Utilisation (USSU) system. Important aspect: interaction between persons.
System overview Input • The organisation: Roles, activities, persons (FTE) • The design of the building in which the organisation is (or will be) housed: the spatial conditions.
System overview Output Movement pattern for each member of the organisation. From this performance indicators can be deduced, like: • Average/maximum walking distance/time per individual. • Number of persons per space in time. • Usage of facilities.
Skeleton activities The core activities for a certain period (a workday). Activities depend on the organisational workflow.Some activities require interaction between employees.
Intermediate activities Activities adjust/complement the skeleton activities.Categories of activities: • Physiologic: getting a drink, having lunch, going to toilet. • Social: having a chat with colleague.
Intermediate activities S-curve method to predict the intermediate activities. Shape of curve influenced by: • Time pressure. • History of executed activities. • Skeleton activity (task).
Scheduler After drawing the skeleton activities: scheduler is activated.Consists of 9 AI (Artificial Intelligence) modules.Responsible for (among others): • Scheduling skeleton activities (SkeletonScheduler) • Scheduling intermediate activities (IntermediateScheduler) • Repairing schedules (OverlapRemover & GapRemover) • Determining interaction between activities (InteractionScheduler) • Finding combinations of activities (CombinationFinder) • Finding an appropriate location (ResourceFinder)
Experiment Capture the real space utilisationUsing RFID to capture the real space utilisation. Merge spaces into zones.
Pedestrian Behaviour • Shopping environment populated with agents representing pedestrians • Agents • are supposed to carry out a set of activities Ai • have different motivational states • move across the network • have perceptualfields that may vary according agent’s awareness threshold and the signalling intensity of a store Context
is the awareness threshold of agent i perceptual field of agent i is the signalling intensity of store j Basic Equation Behavioural Aspects
Estimation Results • Basic equation is estimated for fixed distances • The dichotomous response variable • is the awareness of a store category within the perceptual field • Explanatory variables are • store category • motivation for visiting the city centre
AMANDA framework • Extension of pedestrian/user behaviour models with destination and route choice, and activity scheduling • Domain: pedestrian behaviour in a public space (e.g. shopping environment), user movement in a building (e.g. office building)
Environment • Pedestrians move in a built and/or urban environment • Pedestrians are represented by agents • A hybrid (grid and polygon) based model is used to simulate their behaviour across the network • Each cell in the grid can be considered as an information container object; it has information about which agents and polygons occupy it. Context
Simulation of Individual Behaviour Action Selection strategy, goals, planning Steering path determination Pedestrian Movement Context
AMANDA demo (start AMANDA test application)
Evacuation and smoke simulation • Simple evacuation behaviour: shortest route to exit • CAD vendor independent: IFC based • Using existing smoke simulation: CFAST • No interaction between evacuation and smoke simulation
Evacuation simulation (AMANDA) Occupants data Building model (IFC) Source file (XML) Results Designer User Interface Fire data Smoke simulation (CFAST)
Testcase: Vertigo building • Model created with Autodeks/Revit and exported to IFC • 9-th floor • 26 rooms • 2 exits
IFC input Evacuation simulation IFC Smoke simulation
Smoke simulation: CFAST • Consolidated Model of Fire Growth and Smoke • National Institute of Standards and Technology (NIST) • Import/export facilities • Max 30 spaces, 50 openings
File Input • 3D geometry • Openings • Simulation time, output interval • User interface input • Fire specification
Linking results Evacuation and Smoke simulation • Required egress time < available egress time • Simulation results • Evacuation Space location for each person at any time • Smoke (harmful) conditions in each space at any time. + =
Test results • Total and everage evacuation time • Numbers per exit • Per agent: • Distance covered • Spaces crossed (!) • Walking speed • Per space: • Space utilisation
Safety assesment The main purpose of the Dutch Working Conditions Act (WCA) is to ensure three things: • Safety: no acute dangers for people at work • Health: no long term or chronic physical health risks • Wellbeing: no psychological problem caused by working conditions
Compliance checking • Soft coded regulations Each firm must have a policy stating in what way the personal privacy of individuals is guaranteed. • Hard coded regulations For seated work a free space is present beneath the working surface of at least 70 cm in height and 60 centimeters in depth and width. For office-work the minimal depth for legs and feet is 65 and 80 centimeters respectively.
Example: Soft coded Privacy factors (self defined) In offices that are shared by many people, the chance of privacy problems is higher. Rooms with high ceilings have more sound resonance, which means more inconvenience, which results in less privacy Rooms adjacent to busy corridors suffer from higher sound levels, resulting in more inconvenience Rooms next to windows give a higher feeling of privacy, since people can ‘lose’ themselves in the view
Input Membership function: amountOfPeople Input Membership function: officeHeight Method: Fuzzy logic (1)
Output membership function: privacyProblem Method: Fuzzy logic (2)
Input data • IFC file created with Autodesk/Revit: Building geometry • Organisational data generated with USSU: Acitivity and location for each person at any time • Building physics data generated with ecoTect