Download
1 / 2
20 likes | 60 Vues
The stock market has a seasonal tendency to be stronger from November to April, then, on average, weaker from May through October. Markets underperform about 70% of the time over the “weak” six months from May to October. That leaves similar, or better performance periods during about 30% of the time during these “bad months”. Read More

E N D
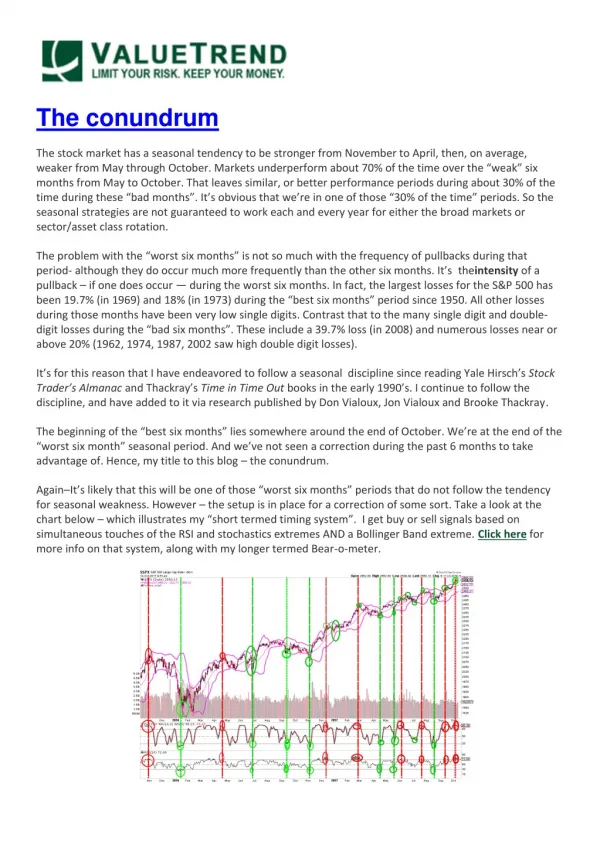
The conundrum The stock market has a seasonal tendency to be stronger from November to April, then, on average, weaker from May through October. Markets underperform about 70% of the time over the “weak” six months from May to October. That leaves similar, or better performance periods during about 30% of the time during these “bad months”. It’s obvious that we’re in one of those “30% of the time” periods. So the seasonal strategies are not guaranteed to work each and every year for either the broad markets or sector/asset class rotation. The problem with the “worst six months” is not so much with the frequency of pullbacks during that period- although they do occur much more frequently than the other six months. It’s theintensity of a pullback – if one does occur — during the worst six months. In fact, the largest losses for the S&P 500 has been 19.7% (in 1969) and 18% (in 1973) during the “best six months” period since 1950. All other losses during those months have been very low single digits. Contrast that to the many single digit and double- digit losses during the “bad six months”. These include a 39.7% loss (in 2008) and numerous losses near or above 20% (1962, 1974, 1987, 2002 saw high double digit losses). It’s for this reason that I have endeavored to follow a seasonal discipline since reading Yale Hirsch’sStock Trader’s Almanacand Thackray’sTime in Time Outbooks in the early 1990’s. I continue to follow the discipline, and have added to it via research published by Don Vialoux, Jon Vialoux and Brooke Thackray. The beginning of the “best six months” lies somewhere around the end of October. We’re at the end of the “worst six month” seasonal period. And we’ve not seen a correction during the past 6 months to take advantage of. Hence, my title to this blog – the conundrum. Again–It’s likely that this will be one of those “worst six months” periods that do not follow the tendency for seasonal weakness. However – the setup is in place for a correction of some sort. Take a look at the chart below – which illustrates my “short termed timing system”. I get buy or sell signals based on simultaneous touches of the RSI and stochastics extremes AND a Bollinger Band extreme. Click here for more info on that system, along with my longer termed Bear-o-meter.
By noting its past signals, you might see that my short termed timing system has been pretty accurate in picking interim tops and bottoms. The magnitude of the move after a buy (green lines) or sell signal (red lines) can be significant, or quite minor. So you don’t bet the farm on its signals. But, if you are like me and have held some cash as part of your seasonal strategy this summer, you will probably want to take advantage of a correction that this system implies may be coming. Interestingly, work by Brooke Thackray shows that the final two weeks of October are the most vulnerable of the month. If Brookes research holds true, this adds ammunition to the short termed timing systems signal. Further, over 40% of sentimentrader.com’s indicators show excess optimism. So a correction – however minor- might be in the cards over the next two weeks. Whether that happens of not, I will be forced through the seasonal discipline to buy back into the market by the first week of November. Over time, the system has proven to outperform the markets, and offers less volatility along the way. Read more - http://www.valuetrend.ca/the-conundrum/