Reference Intervals for New Methods
Reference Intervals for New Methods. Dr Graham Jones Department of Chemical Pathology St Vincent’s Hospital, Sydney www.sydpath.stvincents.com.au. Reference Intervals for new Methods. Subtitle: “Reference Intervals”. Contents. Introduction to reference intervals

Reference Intervals for New Methods
E N D
Presentation Transcript
Reference Intervals for New Methods Dr Graham Jones Department of Chemical Pathology St Vincent’s Hospital, Sydney www.sydpath.stvincents.com.au
Reference Intervals for new Methods Subtitle: “Reference Intervals”
Contents • Introduction to reference intervals • Reference intervals for the new method • Derive de-novo • Transfer from old method • Literature • Other Laboratories • Conclusions
Defining Reference Intervals • Central 95% of results from a reference population • IFCC/NCCLS definition • Excludes 2.5% above and below interval • For healthy population are “Health-associated Reference intervals” • Can be any population, but must be defined • eg, pregnant, premature, hospitalised, treated.
Other forms: • Other statistical cuttoffs • Troponin: 99th centile of healthy population • Apo (a): 80th centile of total population • Recommended interval (decision point) • Impaired fasting glucose (6.1 - 6.9 mmol/L) • Target LDL concentration (<2.0 mmol/L) • Therapeutic Interval • Drugs, INR, APTT, TSH
Current Paradigm • Based on recommendations from the NCCLS and the IFCC • Repeated in Product Information from most reagent suppliers • Encoded in the NATA summary of ISO/IEC guide 17025. • laboratories may perform their own detailed reference interval studies or • may validate reference intervals published elsewhere for their own methods and populations
Generating a new reference interval • Define and select reference population* • Define collection conditions and numbers • Collect samples • Analyse samples • Perform statistical evaluation* • Put into practice • Tietz Textbook covers standard approach very well (HE Solberg)
Define Reference Population • Source • eg blood bank, lab volunteers, students • Numbers • Exclusions • Likely Partitioning • Age • Sex • Other • Difficult to get extremes of age and high numbers
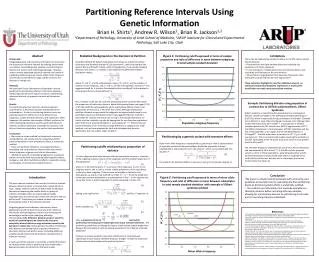
Study Imprecision • Estimates of reference limits has limitations • Expressed as the confidence interval of the Reference Limits, eg 90% CI of the upper and lower reference limits • Confidence intervals decrease as the number of people in the study increases. Large n Small n
Non-parametric statistics • Lowest number where error envelope can be calculated is 120 • For n=120 • 2.5th centile is 4th lowest result • 90% confidence limit for LRL is lowest sample and 7th lowest sample • These values often very scattered giving wide intervals
NORIP STUDY Female ALT (n=1220) 11 19 27 33 41 49 57 ALT (U/L) Female Upper Reference Limit: 45.6 (90% CI 42.5 – 49.3, n=1220) Male Upper Reference Limit: 68 (90% CI 63.4 – 73.6, n=1080)
Generating Intervals • Is hard to do well • Requires time and effort and money • But any local data may be very useful for validation of other intervals
“Impossible” Intervals • Some reference intervals are essentially impossible to produce from local studies: • Paediatric intervals • Stages of pregnancy (eg hCG in 5th week) • Stages of menstrual cycle • Nutritional parameters • Reflects local diet • May normalise deficiency state
Transfer Intervals from previous method • Implies previous intervals are good • Check source and validity • Transfer requires good correlation • Advantage is clinical acceptance • Note: much the following data related to introduction of a Bayer Centaur for Vitamin B12.
Transferring Intervals Wide range of results, assayed over several days, excellent correlation And linearity. Transfer with no problem
Transferring Intervals – more difficult BAYER 181 (top of deficient) 156 (bottom of normal) BECKMAN 107 (bottom of normal) 95% Confidence Limits Slope: 0.78 – 0.86 Intercept: 28 - 48 133 (top of deficient) 126 SydPath
Correlation Data • Patient samples • Focus on results near limits • Beware effect of extreme values on statistics • Passing and Bablock preferred to linear regression • Use correlation data from several days and calibrations • Review source of previous Intervals
Validation of reference intervals • NCCLS protocol • Measure 20 samples appropriate for reference interval on new method • Exclude outliers • If 2 or fewer are outside proposed inetrvals • Accept intervals • If >2 are outside proposed intervals • Measure another 20 • If 2 or fewer are outside – accept intervals • Cannot detect overly wide intervals
Review Previous Method • Previous method may have significant amounts of data (information) • For many assays many of the results will be on “normal” patients • For all assays will allow assessment of previous reference intervals • Methods: • Inspection • Frequency histograms (all data, some data) • Formal methods (Bhattacharya)
Access 126 pmol/L 5.8% rate of “low” results Centaur - predicted 180 pmol/L cuttoff 16% positive rate Assess effect of possible Assay change
Data Mining old results • Bhattacharya, LG. Journal of the Biometric Society. 1967;23:115-135. • Example data: Frequency Distribution of the forkal length of the Porgy caught by pair-trawl fishery in the East China Sea.
Bhattacharya • Assumes Gaussian (or Log Gaussian) distributions • Assumes a significant proportion of requests are on unaffected individuals Creatinine
Data Mining • Bhattacharya ignores effects of outliers and samples not part of majority distribution. • Reference intervals based on majority. Creatinine (mmol/L)
Literature • Look for same method • Equivalent population • Sources • Peer-reviewed publications • Gray Literature • Abstracts (eg AACB, AACC, ACB) • Company literature • Product information (PI) • Other
Literature sources • Vital where population reference intervals may be of limited use • Dietary factors • Special groups • Eg paediatrics • Numbers are prohibitive • eg 99th centile for troponins • Following examples taken from SydPath data for creatinine (Roche) and Vitamin B12 (Centaur)
Combining data • Local and blood bank (M 101, F 110) M: 62 – 105 umol/L F: 51 – 82 umol/L. • Literature: • South Australia (M 293, F 269) Mazzachi BC et al, Clin Lab. 2000;46:53-55 M: 62 – 106 umol/L F: 44 – 80 umol/L • Germany (M 127; F125) Junge et al. Clin Chem Acta. 2004;344:137-148 M: 63 – 103 umol/L F: 48 – 85 umol/L • Values rounded out as follows: M: 60 – 110 mmol/L F: 40 – 90 mmol/L
Literature Sources - distribution 150 300 450 600 750 Vitamin B12 – ACS:180 Klee 2000 (pmol/L) 180 pmol/L
Homocysteine and Methylmalonic acid relative to serum B12 (Centaur) Homocysteine MMA • 1562 people, age >65. MMA and Homocysteine. • B12 measured on Bayer Centaur • Bin width 50 pmol/L. Red Arrow 200 pmol/L. • - Clarke et al, Am J Clin Nutrit. 2003;77:1241-7.
Dorevich Pathology Sikaris et al 25,201 B12 measurements ACS:180 and Bayer Centaur Central 95% of results with Normal Hb and MCV: 178 - 741 pmol/L
Vitamin B12 v MCV • SydPath Data (3 months, 1497 results) • Beckman-Coulter Access 126
Product Information 588 441 VB12, pmol/L 294 181 pmol/L 156 pmol/L 147 140 pmol/L
Centaur Vitamin B12 • 6 studies using Centaur or ACS:180 • Product information • 3 x refereed publications • 1 x AACB abstract • 1 x local study (NZ) • Data combined to make reference interval • Deficient <120 pmol/L • Indeterminate 120 – 180 pmol/L • Replete >180 pmol/L
Product Information… Manufacturer’s Interval: well-defined population, appropriate exclusionsBut: Outliers?, bi/trimodal distribution?
Other laboratories • If someone has done the work, and uses the same method, review their work and apply the intervals. • Need to verify assay bias. • Collaborative effort between several labs with the same method may be a powerful method of setting reference intervals • Spanish Group • NORIP: http://wip.furst.no/norip/
Combining Laboratories • 13 Spanish laboratories (all Centaurs) • 11 – 15 samples from each laboratory (tot 150 samples) • Combined data used for Reference Intervals • Ferre-Masferrer et al. Clin Chem Lab Med 2001;39:166-169
Other Sources: accuracy base • In order to share method-specific literature need to ensure assay accuracy. • “Is my Bloggs method for X working the same as everyone else’s Blogg’s method?” • QAP results • measure QAP samples • look up results for method group • QC material target values • Shared samples
Comparison with QAP targets Method-specific medians (and scatter) available on QAP website
Plea to manufacturers... • Searching refereed literature by trade names can be difficult • ie Abbott, Elecsys, Immulite, Vitros are terms that are not often searchable in Medline, pubmed etc • If companies keep a resource library of information it would be very useful. • Note “google Scholar” can be useful • http://scholar.google.com
Clinical Input • Previous slides about Vitamin B12 are taken from a presentation to haematologists at St Vincent’s Hospital • Actively seeking their input on decision points • Allows inclusiveness and practical input
Putting it all together • Different sources will give (slightly) different values. • Judgement is required to combine data • Other factors include: • Precision of intervals • Long term precision of assay(s) • Biological variation • Rounding for ease of memory • Partitioning
Implementing • Recommend temporary footnote • eg change in method and change intervals, see lab for further details • Make further details available if needed • source document (NATA) • Handout • Website
Conclusions • A new method is a good time to review reference intervals • Uncritical transfer of old intervals is bad practice • Many sources of information can be used • Judgement is required for final decision • Working with other labs may be of great benefit