Advanced Microarray Normalization Methods for Enhanced Data Analysis
Explore new methods for microarray data normalization to account for technical variations during probe preparations. From global to intensity-dependent methods, discover how tools like "R" software package and lowess function can improve your data analysis process. Learn about local and global lowess normalization techniques to remove biases and gradients for accurate results in microarray studies.


Advanced Microarray Normalization Methods for Enhanced Data Analysis
E N D
Presentation Transcript
New normalisation methods for microarrays Robert Schaffer MSU-DOE Plant Research Laboratory Michigan State University E-mail Schaff21@msu.edu
Why normalise? • During probe preparations technical variations can be generated including: • Dye properties • Differences in dye incorporation • Differences in scanning
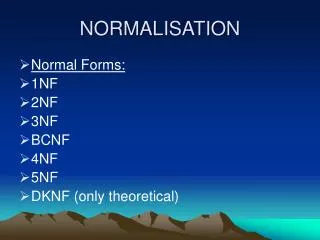
Normalisation methods • Most global normalisation methods assume the two dyes are related by a constant factor R=k*G • Or in log space log2 R/G – c c=log2 k
Expected distribution of ratios Slide A log (Ratio) log (Average intensity)
Some slides show an intensity bias Slide B Slide C Slide D Slide E
Traditional normalisation methods Slide F no norm Slide F log norm Slide B no norm Slide B log norm
Intensity dependent normalisation • Premis that the majority of spots at any intensity will have a ratio of 1 • Calculate a intensity dependent constant to reduce intensity dependent bias log2 R/G-c(A) • R statistical software package has a lowess function which performs local linear fits (Speed’s group) • Non linear method as an Excel macro (Bumgarner’s group)
Terry Speed’s groupUC berkeley/WEHI Web site: http://www.stat.berkeley.edu/users/terry/zarray/Html/index.html
“R” • Freeware • Statistical software package http://www.r-project.org/ • Need to add a library module http://www.stat.berkeley.edu/users/terry/zarray/Software/smacode.html • Quick and easy way to normalise data
statistical microarray analysis (sma) module • sma will normalise, compare slides, and do statistical tests on data • Allows simultaneous multiple slide analysis • To process the data • load experiments into R • describe slide printing configuration • load experiments into a working data set • Analyse data
Normalisation by lowess function Slide F no norm Slide F Lowess norm Slide B no norm Slide B Lowess norm
Local lowess normalisation removes gradient effects Slide D Global lowess normalisation No normalisation Gradient on the array Lowess normalisation by pin Lowess normalisation by scale
M vs A plots do not show gradients Global lowess normalisation Slide D No normalisation Lowess normalisation by pin Lowess normalisation by scale
background subtraction Slide F with NO background subtracted Slide F with background subtracted Slide A with NO background subtracted Slide A with background subtracted
MSU Microarray group Ellen Wisman Robert Schaffer Jeff Landgraf Verna Simon Monica Accerbi Scott Lewis Kim Trouten David Green Pieter Steenhuis Acknowledgements Arabidopsis Functional Genomics Consortium Funded by NSF