Download
1 / 56
560 likes | 604 Vues
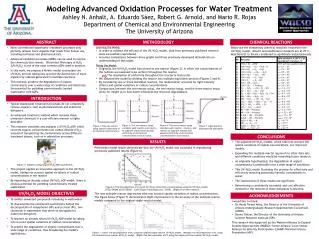
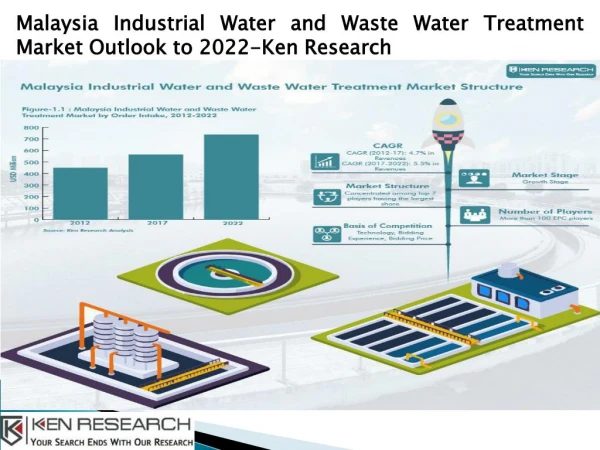
Explore water treatment processes, including oxidation, physico-chemical methods, and filtration, to remove contaminants like chemicals, microbes, and organic compounds for clean drinking water. Learn about the multiple barrier concept and disinfection techniques.

E N D
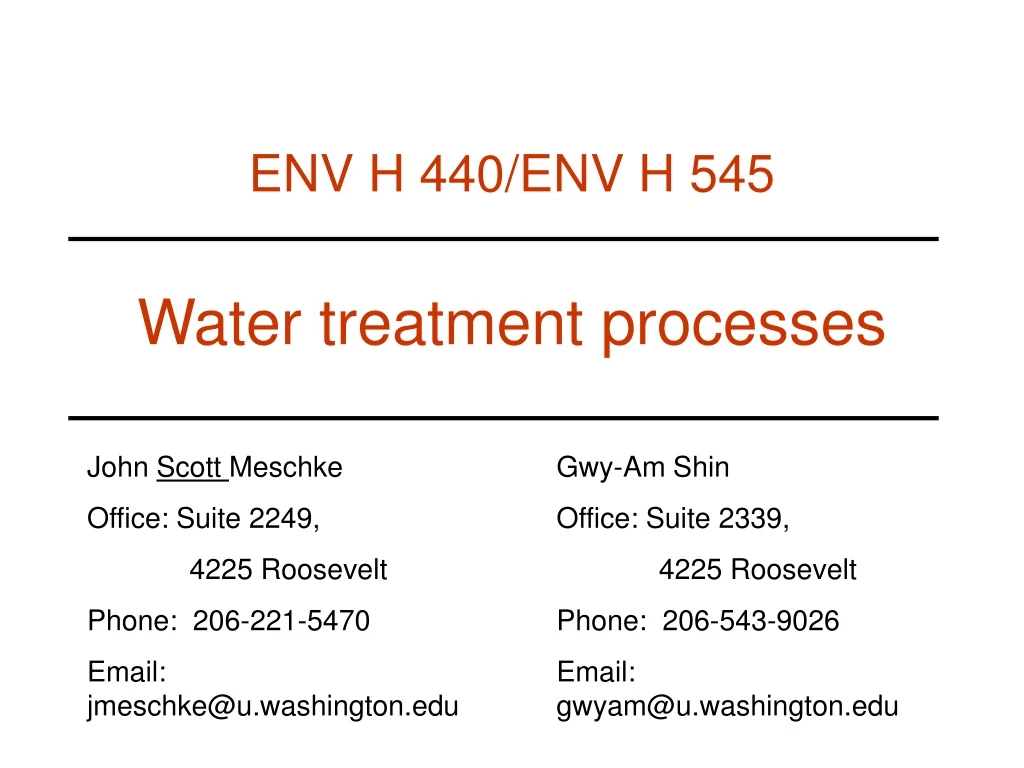
Water treatment processes ENV H 440/ENV H 545 John Scott Meschke Office: Suite 2249, 4225 Roosevelt Phone: 206-221-5470 Email: jmeschke@u.washington.edu Gwy-Am Shin Office: Suite 2339, 4225 Roosevelt Phone: 206-543-9026 Email: gwyam@u.washington.edu
Water contaminants • Chemicals • Inorganics • Organics • Synthetic organic compounds • Volatile organic compounds • Microbes • Viruses • Bacteria • Protozoa parasites • Algae • Helminths
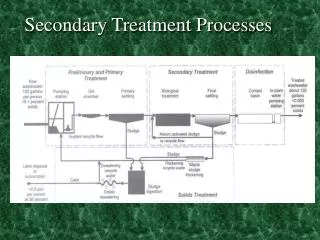
Multiple Barrier Approach to Protect Public Health in Drinking Water • Source Water Protection • Treatment technology • Disinfection • Disinfectant residual in distribution system
Key points • Purpose of the individual unit processes • The typical operating conditions • The outcome of the processes • Microbial reduction of the processes
Oxidation • To remove inorganics (Fe++, Mn++) and some synthetic organics • Cause unaesthetic conditions (brown color) • Promote the growth of autotrophic bacteria (iron bacteria): taste and order problem • Free chlorine, chlorine dioxide, ozone, potassium permanganase • Fe++ + Mn ++ + oxygen + free chlorine → FeOx ↓(ferric oxides) + MnO2 ↓ (manganese dioxide) • Fe (HCO3)2 (Ferrous bicarbonate) + KMnO4 (Potassium permanganase) → Fe (OH)3 ↓(Ferric hydroxide) + MnO2 ↓(manganese dioxide) • Mn (HCO3)2 (Manganese bicarbonate) + KMnO4 (Potassuim permanganase) → MnO2 ↓(manganese dioxide)
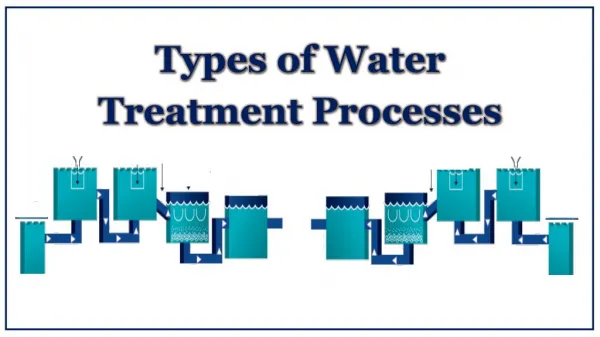
Physico-chemical processes • To remove particles (colloids and suspended solids) in water • Coagulation/flocculation/sedimentation • Filtration
Chemical Coagulant Coagulation chamber • Intense mixing of coagulant and other chemicals with the water • Generally performed with mechanical mixers
Major Coagulants • Hydrolyzing metal salts • Alum (Al2(SO4)3) • Ferric chloride (FeCl3) • Organic polymers (polyelectrolytes)
Al(OH)3 Al(OH)3 Al(OH)3 Al(OH)3 Al(OH)3 Al(OH)3 Al(OH)3 Al(OH)3 Al(OH)3 Colloid Colloid Colloid Coagulation with Metal Salts Soluble Hydrolysis Species + + (Low Alum Dose) (High Alum Dose) Colloid Colloid Alx(OH)y Colloid Floc Al(OH) Charge Neutralization Sweep Coagulation
Flocculation process Water coming from rapid mix. Water goes to sedimentation basin.
Sedimentation Basin Example Water coming from flocculation basin. Water goes to filter. Floc (sludge) collectedin hopper Sludge to solidstreatment
Coagulation/flocculation/and sedimentation • To remove particulates, natural organic materials in water • Coagulation • 20 -50 mg/L of Alumat pH 5.5-6.5 (sweep coagulation) • rapid mixing: G values = 300-8000/second • Flocculation: • Slow mixing: G values = 30-70/second • Residence time:10 -30 minutes • Sedimentation • Surface loading: 0.3 -1.0 gpm/ft2 • Residence time: 1 – 2 hours • Removal of suspended solids and turbidity: 60-80 % • Reduction of microbes • 74-97 % of Total coliform • 76-83 % of fecal coliform • 88-95 % of Enteric viruses • 58-99 % of Giardia • 90 % of Cryptosporidium
Filtration • To remove particles and floc that do not settle by gravity in sedimentation process • Types of granular media • Sand • Sand + anthracite • Granular activated carbon • Media depth ranges from 24 to 72 inches
Filter Example Water coming from sedimentation basin. Anthracite Sand Gravel (supportmedia) Water going to disinfection
Mechanisms Involved in Filtration Floc particles Interception: hits & sticks Flocculation: Floc gets larger within filter Sedimentation: quiescent, settles, & attaches Granular media, e.g., grain of sand Entrapment: large floc gets trapped in space between particles Removal of bacteria, viruses and protozoa by a granular media filter requires water to be coagulated
Rapid filtration • To remove particulates in water • Flow rate: 2-4 gpm/ft2 • Turbidity: < 0.5 NTU (often times < 0.1 NTU) • Reduction of microbes • 50-98 % of Total coliform • 50-98 % of fecal coliform • 10-99 % of enteric viruses • 97-99.9 % of Giardia • 99 % of Cryptosporidium
Disinfection in water • To inactivate pathogens in water • Various types • Free chlorine • Chloramines • Chlorine dioxide • Ozone • UV
C*t99 Values for Some Health-related Microorganisms (5 oC, pH 6-7)
Major contaminants in groundwater • Natural sources • Iron and manganese • Calcium and magnesium (Hardness) • Arsenic • Radionuclide • Artificial sources • Nitrate (from infiltration of fertilizer and surface application of pesticides) • Synthetic and volatile organic compounds (from improper disposal of industrial wastewater)
Iron and Manganese removal • To remove Ferrous iron (Fe++) and manganous manganese ion (Mn++) • Aeration, sedimentation, and filtration • Fe++ + oxygen→ FeOx ↓ (ferric oxides) • Aeration, chemical oxidation, sedimentation and filtration • Fe++ + Mn ++ + oxygen + free chlorine→ FeOx ↓(ferric oxides) + MnO2 ↓ • Fe (HCO3)2 (Ferrous bicarbonate) + KMnO4 (Potassium permanganase) → Fe (OH)3 ↓(Ferric hydroxide) + MnO2 ↓(manganese hydroxide) • Mn (HCO3)2 (Manganese bicarbonate) + KMnO4 (Potassuim permanganase) → MnO2 ↓(manganese hydroxide)
Flow diagram of typical groundwater treatment plant for Fe & Mn removal Aeration* Chemical oxidant* Cl2 ContactBasin Filtration * Alternatives Disinfection (storage for contact time) Well
Hardness removal • To remove Calcium (Ca++) and Magnesium (Mg++) ions • Interfere with laundering by causing excessive soap consumption • May produce scale in hot-water heaters and pipes • Lime (CaO) and soda ash (Na2CO3) • Lime for carbonate hardness • Soda ash for noncarbonate hardness • Equations in next slide
Ion exchange • To remove anions such as nitrate, fluoride, arsenic, and other contaminants or cations such as calcium and magnesium • Ion exchange vessel, a brine tank for regeneration, a storage tank for spent brine and backwash water, and piping for filtration and backwashing
Ion Exchange Process Bulk Salt Raw Water Ion Exchange Column Brine Maker Waste brine (from regeneration of ion exchange media) Treated Water
Anion exchange for nitrate and arsenic removal • Nitrate removal • Arsenic removal
Activated carbon • Manufacture • Usually made from either coal product (bituminous coal, lignite, or peat) or wood product (sawdust, coconut shells, or wood) • Converted to activated carbon by heating the materials to between 300o and 1000oC. • The resulting activated carbon • Are approximately 1 millimeter sized carbon grains • Has large surface area (Handful of GAC has a larger surface area than ten football fields) • Adsorb particles and molecules to surface, usually due to molecular-level electrical forces.
Application of activated carbon (I) • Taste and odor control • Natural organic matters (NOM’s) • Disinfection-by-products (DBP’s) • Other artificial compounds • Volatile organic compounds (TCE, PCE, etc.) • MTBE • Metals
Application of activated carbon (II) • Pressure filters • Gravity filters
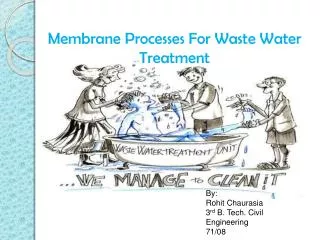
Membrane filtration • To remove colloidal and particulate contaminants including microorganisms (microfiltration and ultrafiltration) or to separate dissolved salts, organic molecules, and metal ions (nanofiltration and reverse osmosis) • Pore size • Microfiltration (0.7 – 7 µm) • Ultrafiltration (0.008 – 0.8 µm) • Nanofiltration (0.005 – 0.008 µm) • Reverse osmosis (0.0001 – 0.007 µm)
Membrane Filtration Processes Size in microns Sand Dissolved Organics Bacteria Viruses Cysts Colloids Salts Conventional granular media / particle filtration Microfiltration Ultrafiltration Nanofiltration Reverse osmosis Membrane Processes
Flow diagram of Membrane Filtration Treatment Plant Fine Screen Porous Membrane Cl2 Retentate (waste) MembraneFiltration Disinfection (storage for contact time)