Download
1 / 17
170 likes | 189 Vues
Explore the direct medical costs linked to diabetes in the U.S., including expenses, distribution of spending, and implications for healthcare services. Learn from a comprehensive study presented at the 129th Annual Meeting of the APHA.

E N D
Medical Costs Associated with Diabetes in the U.S. Presented atThe 129th Annual Meeting of the American Public Health Association Atlanta, GA, October 21–25, 2001 Presented by Amanda A. Honeycutt Linda S. Geiss James P. Boyle Thomas J. Hoerger Kristine R. Broglio Theodore J. Thompson P.O. Box 12194 · 3040 Cornwallis Road · Research Triangle Park, NC 27709Phone: 770-234-5014 · Fax: 770-234-5030 · honeycutt@rti.org · www.rti.org
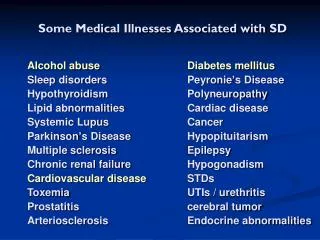
Background • The estimated number of people in the U.S. in 1999 with diabetes was 10.9 million • People with diabetes risk the development of acute metabolic complications and are at increased risk of experiencing chronic complications and general medical conditions • The direct medical costs associated with diabetes and its complications are likely to be large — due to both high per-person costs of diabetes and the large number of people with diabetes
Previous Analyses • 2 main approaches: • Attributable cost method — uses etiologic fractions to attribute health care costs to diabetes • Huse et al. (1989); focus on NIDDM • ADA (1998) • Total/excess cost method — calculate all medical costs (expenses) for people with and without diabetes • Rubin et al. (1994) • ADA (1998) • Our study uses this approach
Study Objective • Develop estimates of the medical costs associated with diabetes by age group: • using recent data on health care utilization and expenditures from the Medical Expenditure Panel Survey (MEPS) • using an approach that controls for skewness in the distribution of medical expenses
Data • 1996 MEPS • Household component • Data on health conditions, use of medical services, charges and payments, demographic characteristics • Medical Conditions file • Data on health conditions self-reported by individuals within each household • 21,268 individual observations; 841 individuals with diabetes • Expenditure categories include office-based and hospital outpatient visits, ambulatory visits to non-MD providers, ER visits, inpatient hospital stays, home health care, prescription drugs, DME, vision aids, and dental care
Methods (I) • Analysis of sample means • Calculate mean expenditures for people with and without diabetes by age group (0–18, 19–44, 45–64, 65–74, 75+ years) • Limitation: means may be sensitive to extreme expenditure values
Methods (II) • Four-equation model • Makes use of 3 characteristics of the medical expenditures distribution to generate estimates that are less sensitive to extreme values (Manning et al., 1987): • A large fraction of the population uses no health services in a given year • Skewed distribution of expenditure — most observations clustered at the low end • Expenditure distribution differs for inpatient users v. outpatient-only users
Four-Equation Model (I) • Four equations are estimated: • Probability of using any health care services • Probability of using inpatient services, conditional on using any health care • Expenditures for inpatient users • Expenditures for outpatient-only users • All equations control for diabetes status, age, race/ethnicity, education, labor force participation, poverty status, family size, health status, region of residence, and health insurance coverage
Four-Equation Model (II) • Results used to generate individual-level estimates of medical expenditures, as follows: E (MED_EXPi) = Pi[i*MED_EXPi IN + (1-i) MED_EXPi OUT] where • Pi = predicted probability of using health care, • i =predicted probability of using inpatient care, and • MED_EXPIN (OUT) = predicted medical expenditures if inpatient (outpatient)
Results — Analysis of Sample Means • Mean medical spending is $1,873 per person for people without diabetes and $7,082 per person for people with diabetes
Results — Distribution of Excess Spending by Type of Health Care Utilization
Results — Four Equations • Statistically significant findings from the 4-equation analysis: • Diabetes is associated with • a 7 percentage point increase in the probability of using medical services, and • a 3 percentage point increase in the likelihood of using inpatient services (given positive health services use) • Among those with outpatient-only expenses, total health care expenses are 60% higher for people with diabetes (controlling for age, race, etc.) • Among those with inpatient expenses, total health care expenses are 20% higher for people with diabetes (controlling for age, race, etc.)
Results — Four-Equation Model (I) • Predicted health care expenses are higher for people with diabetes than those without
Results — Four-Equation Model (II) • Compares predicted expenditures for people with diabetes to their predicted expenditures under the assumption of no diabetes (DIABETES = 0) • Estimated excess medical spending associated with diabetes is approximately $3,100 across all age groups
Comparison of Four-Equation Model Results to Previous Study Findings • Predicted excess medical expenses comparing people with diabetes to their expenses if DIABETES =0 • Similar to attributable cost estimates from Huse et al. (1989) • Huse et al. estimates are $3,100–4,400 per person for M/F >65 years (in 1996$) • Lower than attributable cost estimates from ADA (1998) • ADA estimates are $4,100–$5,700 across all ages (in 1996$) • Predicted excess medical expenses for people with diabetes in MEPS v. those without • Lower for 45–64 years and higher for 75+ years than findings from ADA (1998) or Rubin et al. (1994)
Study Limitations • Nursing home costs are excluded • Productivity losses are excluded • Small sizes of population subgroups (age/sex) with diabetes in MEPS • Ranged from 51 to 182 observations for adult age groups
Summary and Conclusions • Findings suggest that annual medical costs associated with diabetes are approximately $1,500 for 19–44 year-olds, $2,700 for 45–64 year-olds, $3,600 for 65–74 year-olds, and $4,400–$4,800 for 75+ years • An estimated 10.9 million people in the U.S. had diabetes in 1999 (Boyle et al., 2001) • Suggests aggregate excess medical costs likely exceed $34 billion (10.9M ´ $3130; in 1996$) • Findings suggest that projected growth in diabetes to 35.5 million people in 2050 could lead to diabetes-related (excess) medical costs of $111 billion