Spectroscopic Analysis of 1,8-Dihydroxy-2-naphthaldehyde Proton Transfer in Different Solvents
70 likes | 97 Vues
The study analyzes vertical excitation and emission energies for 1,8-Dihydroxy-2-naphthaldehyde in cyclohexane, dichloromethane, and acetonitrile. It explores normal and tautomer forms, potential energy surfaces, and reaction paths using PCM and TD-B3LYP calculations.

Spectroscopic Analysis of 1,8-Dihydroxy-2-naphthaldehyde Proton Transfer in Different Solvents
E N D
Presentation Transcript
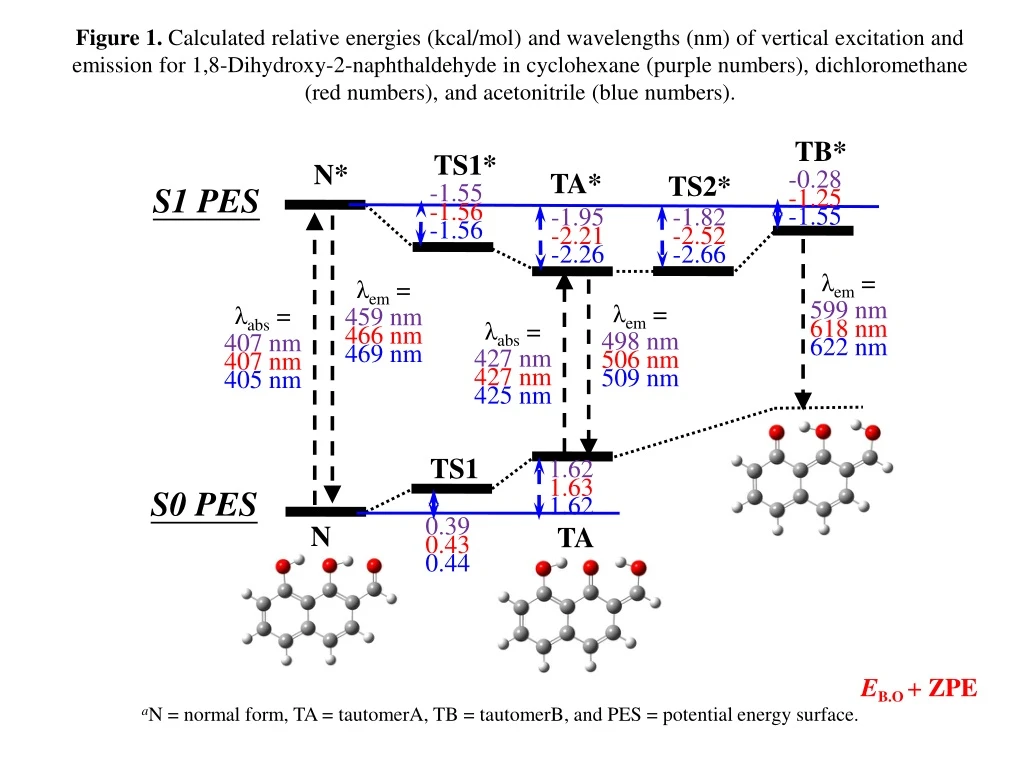
Figure 1. Calculated relative energies (kcal/mol) and wavelengths (nm) of vertical excitation and emission for 1,8-Dihydroxy-2-naphthaldehyde in cyclohexane (purple numbers), dichloromethane (red numbers), and acetonitrile (blue numbers). TB* TS1* N* TS2* TA* -0.28 -1.25 -1.55 S1 PES -1.55 -1.56 -1.56 -1.95 -2.21 -2.26 -1.82 -2.52 -2.66 λem = 599 nm 618 nm 622 nm λem = 459 nm 466 nm 469 nm λem = 498 nm 506 nm 509 nm λabs = 407 nm 407 nm 405 nm λabs = 427 nm 427 nm 425 nm TS1 1.62 1.63 1.62 S0 PES 0.39 0.43 0.44 N TA EB.O + ZPE aN = normal form, TA = tautomerA, TB = tautomerB, and PES = potential energy surface.
Figure 1. Calculated relative energies (kcal/mol) and wavelengths (nm) of vertical excitation and emission for 1,8-Dihydroxy-2-naphthaldehyde in cyclohexane (purple numbers), dichloromethane (red numbers), and acetonitrile (blue numbers). TS2* TS1* TB* N* -0.28 -0.84 -0.94 S1 PES TA* 0.27 0.30 0.31 -0.56 -1.76 -2.06 -2.38 -2.57 -2.61 λem = 599 nm 618 nm 622 nm λem = 459 nm 466 nm 469 nm λem = 498 nm 506 nm 509 nm λabs = 407 nm 407 nm 405 nm λabs = 427 nm 427 nm 425 nm TS1 2.59 2.60 2.60 S0 PES 1.52 1.53 1.54 N TA EB.O aN = normal form, TA = tautomerA, TB = tautomerB, and PES = potential energy surface.
Figure 2.Calculated HOMO (π) and LUMO (π*) of normal form (N) and tautomerA form (TA) for 1,8-Dihydroxy-2-naphthaldehyde. N TA LUMO HOMO
Figure 3. Two dimensional potential energy map of the ground state (S0) double proton transfer reaction and reaction path (the solid pink circle) in the 1,8-Dihydroxy-2-naphthaldehyde system in CH3CN solvent by PCM calculated at B3LYP/6-31+G(d,p) level. The energies (EB.O in kcal/mol) are relative to that of the normal form. TA N N = normal form TA = tautomer A TB = tautomer B TS = transition state
Figure 4. Two dimensional potential energy map of the 1st excited state (S1) double proton transfer reaction and reaction path (the solid pink circle) in the 1,8-Dihydroxy-2-naphthaldehyde system in CH3CN solvent by PCM calculated at TD-B3LYP/6-31+G(d,p) level. The energies (EB.O in kcal/mol) are relative to that of the normal form. TB TA N N = normal form TA = tautomer A TB = tautomer B TS = transition state
Figure S1. Calculated relative energies (kcal/mol) and wavelengths (nm) of vertical excitation and emission for 1,8-Dihydroxy-2-naphthaldehyde in cyclohexane (purple numbers), dichloromethane (red numbers), and acetonitrile (blue numbers) with higher basis set 6-311+G(2df,2pd) for single-point calculation. TB* TS1* N* TS2* TA* -0.17 -0.52 -0.58 S1 PES -1.28 -1.20 -1.17 -1.87 -1.84 -1.80 -1.50 -1.67 -1.64 λem = 605 nm 597 nm 590 nm λem = 464 nm 460 nm 458 nm λem = 460 nm 496 nm 493 nm λabs = 409 nm 410 nm 409 nm λabs = 429 nm 431 nm 429 nm TS1 1.82 1.88 1.87 S0 PES 0.74 0.98 0.98 N TA EB.O + ZPE aN = normal form, TA = tautomerA, TB = tautomerB, and PES = potential energy surface.