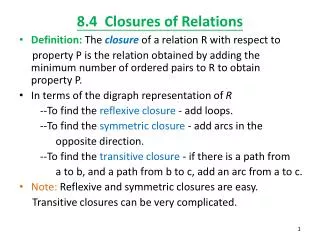
Relations Diagram (or Interrelationship Digraph)
Relations Diagram (or Interrelationship Digraph). Relations Diagram (or Interrelationship Digraph). Definition : An interrelationship digraph is a visual display that maps out the cause and effect links among complex, multivariable problems or desired outcomes.

Relations Diagram (or Interrelationship Digraph)
E N D
Presentation Transcript
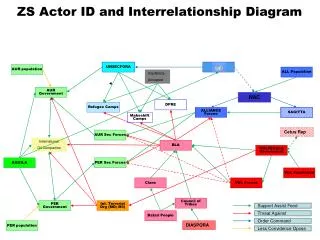
Relations Diagram (or Interrelationship Digraph) Definition: An interrelationship digraph is a visual display that maps out the cause and effect links among complex, multivariable problems or desired outcomes.
To create a Relations Diagram: • 1. Add a symbol to the diagram for every element involved in the issue. • 2. Compare each element to all others. Use an "influence" arrow to connect related elements (drawn from the element that influences to the one influenced). • If two elements influence each other, the arrow should be drawn to reflect the stronger influence. • 3. The elements with the most outgoing arrows will be root causes or drivers. The ones with the most incoming arrows will be key outcomes or results.
It is less frequently used than the other 7 New QC Tools. • However, in a fairly tangled situation, it is a powerful means of forcing a group to map out the interactions between factors, and usually helps bring the most important issues into focus.
Relationship Diagram: More information http://syque.com/quality_tools/toolbook/Relation/relation.htm Eg. Practical Variations