Download
1 / 28
280 likes | 426 Vues
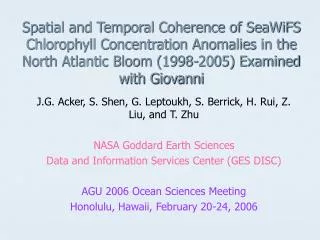
Spatial and Temporal Coherence of SeaWiFS Chlorophyll Concentration Anomalies in the North Atlantic Bloom (1998-2005) Examined with Giovanni. J.G. Acker, S. Shen, G. Leptoukh, S. Berrick, H. Rui, Z. Liu, and T. Zhu NASA Goddard Earth Sciences Data and Information Services Center (GES DISC)

E N D
Spatial and Temporal Coherence of SeaWiFS Chlorophyll Concentration Anomalies in the North Atlantic Bloom (1998-2005) Examined with Giovanni J.G. Acker, S. Shen, G. Leptoukh, S. Berrick, H. Rui, Z. Liu, and T. Zhu NASA Goddard Earth Sciences Data and Information Services Center (GES DISC) AGU 2006 Ocean Sciences Meeting Honolulu, Hawaii, February 20-24, 2006
This presentation displays area plots and Hovmöller latitude vs. time plots of chlorophyll concentration anomalies in the North Atlantic Bloom.The first slide for each year displays the cumulative anomaly plot for the period April-July and the accompanying latitude vs. time plot for the entire region.The second slide for each year displays the monthly area plots of the chlorophyll anomalies.The third slide for each year displays the latitude vs. time plots for three selected cross-sections of the North Atlantic.
North Atlantic Bloom: 1998 July June May April
North Atlantic Bloom: 1998 Arrows designate regions of interest during this bloom
Regions 1&2 exhibit May-June negative anomalies between 45 and 54 N. Region 3 shows positive anomaly in May, negative anomaly in June-July above 54 N. North Atlantic Bloom: 1998
North Atlantic Bloom: 1999 July June May April
North Atlantic Bloom: 1999 Arrows designate regions of interest during this bloom
Region 1 has a strong negative anomaly in May near 45 N; and a strong positive anomaly above 57 N (coastal Greenland) in June. Region 2 shows positive anomalies between 45 and 54 N in April, May, and June. Region 3 has a strong negative anomaly in May above 57 N. North Atlantic Bloom: 1999
North Atlantic Bloom: 2000 July June May April
North Atlantic Bloom: 2000 Arrows designate regions of interest during this bloom
Region 1 has a very strong negative anomaly at high latitudes in May, and a positive anomaly in July between 51-54 N. Region 2 has a very strong high latitude positive anomaly in May, and a strong negative anomaly just above 54 N in June. Region 3 is dominated by the very strong high latitude positive anomaly in May. North Atlantic Bloom: 2000
North Atlantic Bloom: 2001 July June May April
North Atlantic Bloom: 2001 Arrows designate regions of interest during this bloom
Region 1 has positive anomalies near Newfoundland (42 N) in April, and near Greenland (above 57 N) in May. Region 2 shows positive anomalies throughout the bloom, Especially between 42-48 N in June and July. Region 3 shows a positive anomaly pattern through most of the season, with negative anomalies at high latitudes in July. North Atlantic Bloom: 2001
North Atlantic Bloom: 2002 July June May April
North Atlantic Bloom: 2002 Arrows designate regions of interest during this bloom.
In a remarkable bloom year, Region 1 showed positive anomalies in April south of Newfoundland (45 N) which propagated north during the ensuing months. In contrast, Region 2 had negative anomalies near 45 N which also propagated northward during the bloom. Region 2 also had a noticeable southern positive anomaly persistent through the bloom. Region 3 shared the persistent southern positive anomaly, and also had positive anomalies off the coast of Ireland. North Atlantic Bloom: 2002
North Atlantic Bloom: 2003 July June May April
Arrows designate regions of interest during this bloom. The strong negative and positive anomalies east and south of Newfoundland receive additional discussion in the poster. North Atlantic Bloom: 2003
Region 1 features the strong negative anomaly east and south of Newfoundland in April, which was followed in the south by a positive anomaly in May. In Region 2, the negative anomalies propagate northward from 42 N, with positive anomalies south of 45 N particularly evident in June and July. Region 3 shows a quick switch in the high latitudes from a negative anomaly in May to positive anomalies in June and July. North Atlantic Bloom: 2003
North Atlantic Bloom: 2004 July June May April
North Atlantic Bloom: 2004 Arrows designate regions of interest during this bloom.
Region 1 exhibited the most variety during this bloom season, with strong negative anomalies evident early in the far north (perhaps related to heavy cloud cover), and patchy positive and negative anomalies in May and June. Regions 2 and 3 should be considered together; May featured a distinctly bipolar anomaly distribution with positive anomalies in Region 2 (western North Atlantic) and negative in Region 3 (eastern North Atlantic). Positive anomalies dominated the higher latitudes in Region 3 in June and July. North Atlantic Bloom: 2004
North Atlantic Bloom: 2005 July June May April
North Atlantic Bloom: 2005 Arrows designate regions of interest during this bloom.
Region 1 displayed a remarkably similar anomaly pattern during this season to the 2004 bloom season, with high latitude negative anomalies and positive anomalies between 42-51 N in April. Negative anomalies occurred in the middle zone in June and July. In Region 2, the most noticeable anomalies were positive between 45-54 N in May and between 54-60 N in July. Region 3 was also similar to 2004, with persistent negative anomalies between 42-54 N in May and June, and positive anomalies in June and July apparent above 54 N. North Atlantic Bloom: 2005
Summary The chlorophyll concentration mean values used to generate the climatological anomalies are based on an observational record that only covers seven North Atlantic Blooms (SeaWiFS was launched in September 1997). It is therefore not surprising that there are very few “average” months or bloom seasons, and that the chlorophyll anomalies, either positive or negative, dominate this method of characterizing the variable North Atlantic Bloom. Initial evaluation of this observational record indicates that the monthly anomalies exhibit a significant degree of spatial and temporal coherence ̶ meaning that the anomalies are positive or negative over large areas and connected over several months, rather than exhibiting a pattern of “diffuse interspersion” of mixed positive and negative anomalies. This observation indicates that the factors creating the anomaly pattern in any particular bloom are influential over large areas. Such factors must include circulation dynamics (ocean current variability) and meteorological dynamics (cloud cover variability) which are directly related to the availability of nutrients and sunlight. As shown in the poster presentation regarding the 2003 bloom season, the chlorophyll anomaly feature of Giovanni enables a rapid identification of where and when unusual variability in the bloom occurred. This identification facilitates examination of the causal factors underlying the variability.