Enhancing Graphics for Educational Feedback and SMART Response Tools
This document outlines the process of modifying existing graphics to improve visual communication in educational settings. Using Microsoft Paint and PowerPoint, graphics were altered to add color and context. Key modifications included coloring cartoon figures to attract attention, adding explanatory text boxes for clarity, and grouping elements for cohesive visual guides. The enhanced visuals support educators in understanding and utilizing SMART Response tools, as well as comparing approaches in Response to Intervention (RtI) initiatives, ultimately aiming to facilitate better instructional practices.

Enhancing Graphics for Educational Feedback and SMART Response Tools
E N D
Presentation Transcript
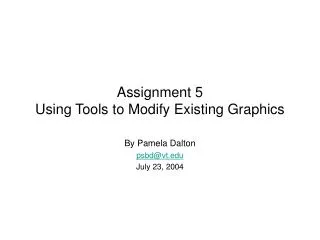
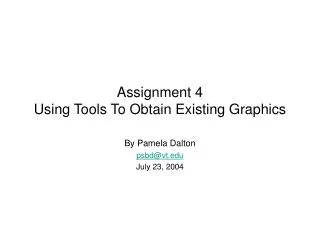
Using Tools to Modify Existing Graphic Needs Kimberly Sink kimss@vt.edu February 23, 2011
Modified Graphic Topic: Feedback • The graphic was imported into Microsoft Paint. • I used the paint tools to give the cartoon people color. • I also wrote the word multiply on the board. • The modifications I made adds color to the cartoon which “draws” peoples’ attention more.
Modified GraphicTopic: Smart Response • An arrow was added to the graphic using the drawing tools in Power Point. • The SMART Response graphic was inserted • A text box was included to explain the graphic • All the graphics were then grouped together to create one image • The modifications I added give individuals a visual explanation of how to activate the SMART Response software tools.
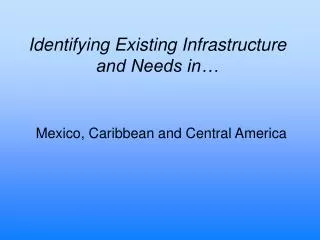
Modified GraphicTopic: RtI • The RtI triangles were imported into Microsoft Paint where they were placed together and resized. • The file was saved and imported in to Power Point. • A text box was added to the graphic and grouped with the triangles. • The modifications to this graphic may help individuals compare the different approaches states take to implementing Response to Intervention initiatives. What are the similarities and differences?