Environmental metagenomics with next generation sequencing
170 likes | 382 Vues
Environmental metagenomics with next generation sequencing. 2009-11 SAGES and Soybean Rust Sampling Network. Lacombe. Agassiz. Saskatoon. Ottawa. Beloeil. Morden. St. Clotilde. Morrisburg. Forest. Harrington, PEI. Toronto. 350 air and rain samples processed

Environmental metagenomics with next generation sequencing
E N D
Presentation Transcript
2009-11 SAGES and Soybean Rust Sampling Network Lacombe Agassiz Saskatoon Ottawa Beloeil Morden St. Clotilde Morrisburg Forest Harrington, PEI Toronto 350 air and rain samples processed 60M DNA barcode sequences (bacteria & fungi) Woodslee Caledonia St. Thomas Harrow Ridgetown
Types of Samplers in the 2010-11 Environmental Sampling Network JB: rain is filtered directly in the field through a filter (0.45uM or 8uM) BK: air samples collected directly into a sterile tube YE: rainwater is collected in a bucket, vacuum-filtered in the labthrough a 0.45 µm filter
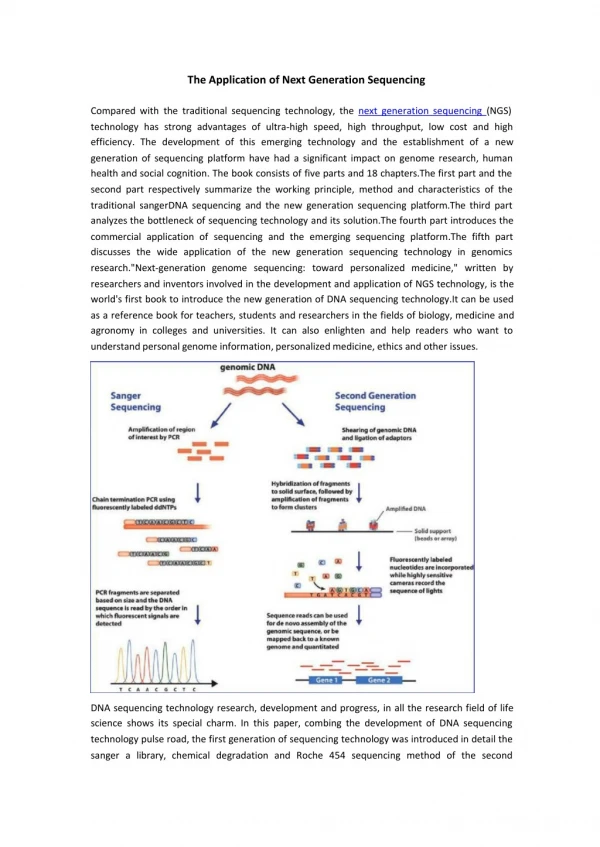
Matching barcode sequences from environment to references Unresolved names Gaps in collections and taxonomy Biological Collections DNA barcodes (>50K/ sample) DNA Environmental sample NGS DNA sequencers
Samplers in different locations (2010-2011*) * Collector running for one week. DNA sequenced every 4 week. 5 samples processed per summer. 2007-9 also available, but less sites. http://www.encyclopedia.com/video/SS4ZnFAv7iY-classification-les-agaricales.aspx http://www.encyclopedia.com/video/SS4ZnFAv7iY-classification-les-agaricales.aspx JB BK YE_LD
Sampler efficiency in trueFungitotal number of sequences on left and ratio between 3 sites http://www.encyclopedia.com/video/SS4ZnFAv7iY-classification-les-agaricales.aspx JB BK YE_LD
Sampler efficiency in trueFungi - total number of sequences on left and ratio between 3 sites http://www.encyclopedia.com/video/SS4ZnFAv7iY-classification-les-agaricales.aspx http://www.encyclopedia.com/video/SS4ZnFAv7iY-classification-les-agaricales.aspx JB BK YE_LD
Numbers of unique fungal species represented in AAFC national herbarium (DAOM) & in GenBank (NCBI) with at least one ITS sequence Downy Mildews Rusts Powdery Mildews
GENOMICS R&D INITIATIVEQuarantine and Invasive Species ProjectPATRICE BOUCHARD AND ANDRÉ LÉVESQUEAgriculture and Agri-Food CanadaNovember 21, 2012CFIA Plant Business Line Committee meeting
Scope Building targeted reference libraries of genetic data (Barcodes) to aquatic and terrestrial organisms of greatest concern to Canada Libraries will ultimately be made available to the national and international scientific community Develop focused metagenomic approaches for the direct detection of invasive species from complex environmental samples Finfish (2.1) Tunicates (2.2) Parasites (2.3) Arthropods (3.1) Nematodes (3.2) Fungi (3.3) Plants (3.5) Viruses (3.4) DNA extraction PCR amplify with universal markers (e.g. 16S, ITS, cpn60, COI, matK) Sequencing reactions GRDI Barcode of Life Database (BOLD) BOLD at Guelph, iBOL and GenBank Sanger sequencing @NRC RNA/DNA whole genomes
Distribution of species of associated with agriculture primarily found in each country
Number of species shared with Eurasia is lower than among our three countries and impact of introduction is higher between continents
Average count of each OTU (Fungi) comparing imported and Canadian grains Each dot represents a known or putative new species Sample numbers: Imported from Asia = 8; Canadian samples = 130 Grain samples imported from Asia PRELIMINARY RESULTS Total of 32,307 OTU’s Canadian grain samples OTU’s absent in Canada: Potential alien risk for NA crops if becomes established OTU’s present in Canada but absent in imports tested so far: Potential risk for NA trade Present both in Canada and in imports – low risk
Unknown sweet potato viruses in “clean” plants – The first reality check about potential trade impact
Thank you Native species Trichalophusgranicollis Regulated pest Otiorhynchusligustici Photos from Patrice Bouchard, AAFC Ottawa, Coordinator of GRDI project