Download
1 / 14
140 likes | 268 Vues
Independent Study Atmospheric Effects on Aircraft Gas Turbine Life Humidity Section Revised May 23, 2011. Kevin Roberg. Contents: Introduction Atmospheric Composition Atmospheric Structure Standard Model of the Atmosphere Sample Altitude Model Result Measures of Humidity

E N D
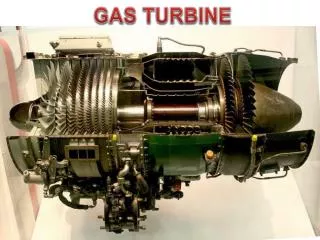
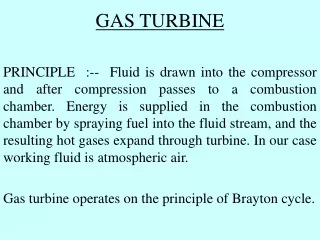
Independent Study Atmospheric Effects on Aircraft Gas Turbine Life Humidity Section Revised May 23, 2011 Kevin Roberg
Contents: • Introduction • Atmospheric Composition • Atmospheric Structure • Standard Model of the Atmosphere • Sample Altitude Model Result • Measures of Humidity • Humidity Relationships • Virtual Temperature • Water Vapor Distribution • References
It is said in New England “Don’t like the weather? Wait a minute, it will change.” This is in fact true in the majority of locations on earth. It is also true that change can be found in any direction, including up. This study examines the effect of atmospheric conditions on the life of aircraft gas turbines. It is impractical, if not impossible, to model the instantaneous structure of the atmosphere during every flight in the life of an engine. Fortunately, it is possible to describe an average atmosphere which, over the course of many flights and a long period of time, closely resembles the environment experienced in operation. The relationships developed in this study describe average conditions. They will rarely, if ever, correctly describe instantaneous conditions exactly. Where there structure of the atmosphere can consistently differ from the average, such as a ground level inversion present each morning or evening, these effects are described.
Atmospheric Composition • Individual gasses may be analyzed using partial pressure (Dalton’s Law) • Water Vapor may be 0-4% by Volume
Atmospheric Structure The earth’s atmosphere is divided into distinct layers delineated by temperature extremes. Beginning at the ground where temperatures are warmest, with energy being derived from absorption of visible light. Temperature decreases with distance from the ground until the stratosphere is reached. Temperature increases through the stratopause until the level where most ultraviolet light is absorbed, the stratopause. After passing the stratopause temperature again declines through the mesosphere, until entering the troposphere where most other radiation is absorbed. The troposphere is the portion of the atmosphere nearest the ground in which nearly all clouds and weather occur. The temperature of the troposphere decreases linearly with altitude. The top portion of the troposphere is the tropopause. Within the tropopause temperature is constant. The transition from troposphere nominally occurs at a height of 11 km. The tropopause continues to a height of 20 km. Since aircraft activity using gas turbines is generally confined to altitudes well below 20 km only the tropopause and troposphere will be considered in this study. (Refer to page 13 of Stull for additional detail)
Standard Model of the Atmosphere Aircraft generally operate within the troposphere and tropopause. Conditions within these portions of the atmosphere can be modeled using: Troposphere (T>216.65 K) Where: is a constant so the P is equal to sea level pressure at seal level (101.325kPa for standard conditions). The value is the temperature lapse rate, which on average is constant regardless of location and season (Dutton). As discussed on the previous slide, it may be far from constant at any given time due to inversions or other weather phenomena. is a sea level temperature (288.15K for standard conditions) (Refer to companion paper for development of these equations) These equations are applicable for most day and night conditions but at night, in cases where the surface is cooler than that atmosphere, such as winter or marine conditions temperature may increase with altitude briefly before resuming the normal stratospheric pattern. Such a situation is termed an inversion. (Dutton)
Standard Model of the Atmosphere Temperature is constant within the tropopause. The tropopause begins when the troposphere reaches the tropopause temperature. Tropopause (T=216.65 K) Height (H) at which the tropopause begins Where: is the pressure of the troposphere when the temperature is 216.65K (22.632kPa for standard conditions)
Sample Altitude Model Result Note that the divergence between temperatures increases until reaching the 0 degree C tropopause. At this point a small artifact of the model is evident, and pressures begin to converge.
Measures of Humidity • Relative Humidity: The amount of water in the atmosphere compared with the saturation level. • 0% is not water vapor • 100% is maximum water vapor for current temperature. • Dew Point: The temperature at which the current amount of water in the atmosphere will reach saturation. • Can be measured by chilling a mirror until dew forms • Partial Pressure: The portion of atmospheric pressure contributed by water vapor • Absolute Humidity: The mass of water vapor in a given volume (density). • Mixing Ratio: The ratio of the mass of water to the mass of air in the atmosphere. • Useful quantity for ideal gas law calculations
Humidity Relationships: All subscripts indicate the saturation condition is partial pressure is absolute humidity is mixing ratio is the density of dry air is the gas constant of dry air: is the gas constant of water vapor: (Equations from Stull pages 98-99)
Virtual Temperature: Water vapor (mol. weight 18) is less dense than dry air (mol. weight 28.96). Meteorologists account for the reduction in overall molecular weight by including a virtual temperature in ideal gas calculations: Thus humid air acts like hotter air. (Stull p. 8)
Water Vapor Distribution: • In the actual atmosphere the water vapor distribution with increasing altitude cannot be predicted using an equation. • By averaging over a period of time relative humidity can be assumed to be constant up to the tropopause. • At the tropopause water content is negligible. Instantaneous (Chiang, et al) Averaged (Tomasi, et al)
Daily Variation: In a still atmosphere with no precipitation the amount of water, measured either by absolute humidity or mixing ratio, will remain stable throughout daily temperature variations. If local temperature drops below the dew point, dew will form. In cases when inversions occur due to a relatively cool surface, low lying fog may form though moisture remains in vapor form at higher elevations.
References: Chiang, C.-W., & Subrata Kumar Das, J.-B. N.-x.-l. (2009, August). Simultaneous measurement of humidity and temperature in the lower troposphere over Chung-Li, Taiwan. Journal of Atmospheric and Solar-Terrestrial Physics, 71(12), 1389-1396. Dutton, J. A. (1986). The Ceaseless Wind. Mineola, New York, United States of America: Dover Publications Stull, R. B. (2000). Meteorology for Scientists and Engineers (2nd ed.). Belmont, CA, USA: Brooks/Cole. Tomasi et al, C. (2004). Mean vertical profiles of temperature and absolute humidity from a 12-year radiosounding data set at Terra Nova Bay (Antarctica). Atmosperic Research(71), 139-161.