Download
1 / 37
380 likes | 736 Vues
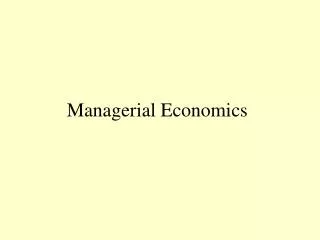
PPA 723: Managerial Economics. Lecture 11: Costs. Managerial Economics, Lecture 11: Costs. Outline Short-Run Cost Curves The Input Mix Decision Long-Run Cost Curves. Managerial Economics, Lecture 11: Costs. Review Short run production concepts: Total, average, and marginal products.

E N D
PPA 723: Managerial Economics Lecture 11: Costs
Managerial Economics, Lecture 11: Costs Outline • Short-Run Cost Curves • The Input Mix Decision • Long-Run Cost Curves
Managerial Economics, Lecture 11: Costs • Review • Short run production concepts: • Total, average, and marginal products. • MPL=APL at maximum APL • Law of Diminishing Marginal Returns • Long-run production concepts • Isoquant • MRTS = MPL/MPK • Returns to Scale
Managerial Economics, Lecture 11: Costs From Production to Cost • Production concepts examine the amount of input(s) needed to produce a given output. • Cost concepts examine the cost of the inputs needed to produce a given output. • Thus cost concepts combine production concepts with input prices.
Managerial Economics, Lecture 11: Costs Short-Run Cost Measures • Fixed cost (F): production expense that does not vary with output. • Variable cost (VC): production expense that changes with quantity of output produced. • Total cost (C): C = VC + F
Managerial Economics, Lecture 11: Costs Average Cost Concepts • Average fixed cost: AFC = F /q • Average variable cost: AVC = VC /q • Average (total) cost: AC = C/q = AFC + AVC
Managerial Economics, Lecture 11: Costs Marginal Cost • Marginal cost, MC, is the cost of producing the last unit • MC is the change in cost, C, when output changes by q • That is, MC = C/q
Managerial Economics, Lecture 11: Costs Sunk Fixed Cost • We usually assume fixed cost is sunk, i.e., expenditure that cannot be recovered. • The opportunity cost of capital is zero • because you can't get this expenditure back no matter what you do. • So ignore it when making decisions • Example: walk out of a bad movie early, regardless of what you paid to attend • Otherwise, fixed cost is called avoidable.
(a) Managerial Economics, Lecture 11: Costs Cost, $ 400 C VC 27 A 1 216 Figure 7.1 Short-Run Cost Curves 20 1 B 120 48 F 0 2 4 6 8 10 Quantity, q , Units per day (b) Cost per unit, $ 60 MC AC a 28 27 AVC b 20 8 AFC 0 2 4 6 8 10 Quantity, q , Units per day
Managerial Economics, Lecture 11: Costs MC, AC, and AVC Curves • AC and AVC curves fall when MC is below them, and rise when MC is above them. • Therefore, the MC curve intersects the AC and AVC curves at their minimum points.
Managerial Economics, Lecture 11: Costs Example • Suppose the short-run cost function is • C = 125 + 2q + q2 • What are the: • fixed cost • variable cost • average cost • average fixed cost • average variable cost?
Managerial Economics, Lecture 11: Costs Answer If C = 125 + 2q + q2 Fixed cost = F = 125 Variable cost = VC = 2q + q2 Average cost = AC = C/q = 125/q + 2 + q Average fixed cost = AFC = 125/q Average variable cost = AVC = 2 + q Note: marginal cost = MC = 2 + 2q
Managerial Economics, Lecture 11: Costs Production Functions & Cost Curves • A production function shows the inputs needed to produce a given output. • A firm's cost is found by multiplying the quantity of each input by its price and summing across inputs. • Higher average or marginal productivity implies lower average or marginal cost, so cost curves are U-shaped—the inverse of product curves.
Managerial Economics, Lecture 11: Costs Application Short-Run Cost Curves for a Printing Firm (with continually rising AVC) Cost, kroner 50 MC 40 30 AC AVC 20 10 AFC 0 100 200 300 q , Units per year
Managerial Economics, Lecture 11: Costs Cost Effects of $10 Tax • This tax affects variable but not fixed cost • After-tax (a) cost = before-tax (b) cost + 10q: Ca = Cb + 10q • At every quantity, AVC, AC, and MC curves shift up by $10: AVCa = AVCb + $10 ACa = ACb + $10 MCa = MCb + $10
Managerial Economics, Lecture 11: Costs Figure 7.3 Effects of a Specific Tax on Cost Curves Costs per unit, $ a b MC = MC + 10 80 b MC $10 a b AC = AC + 10 37 b $10 AC 27 0 5 8 10 15 q , Units per day
Managerial Economics, Lecture 11: Costs Long-Run Costs • A firm adjusts all its inputs so its cost of production is as low as possible. • If capital and other variable costs can be varied, LR fixed costs equal zero (F = 0). • Thus LR total cost = LR variable cost: C = VC
Managerial Economics, Lecture 11: Costs Input Choice • To understand LR cost curves, we must examine a firm’s input mix decision. • A firm chooses from all technologically efficient combinations of inputs, the economically efficient combination of inputs.
Managerial Economics, Lecture 11: Costs The Iso-Cost Line • Isocost line: all combinations of inputs that require the same (iso) total expenditure (cost). • If cost is C = wL + rK • then isocost is • where is a fixed level of cost • An isocost line is analogous to a budget constraint.
Managerial Economics, Lecture 11: Costs K , Units of Figure 7.4 A Family of Isocost Lines capital per year $150 = 15 — — — $ 10 $100 e = 10 — — — $ 10 d c $50 = 5 — — — $10 b $ 50 isocost $100 isocost $150 isocost a $50 $100 $150 = = = — — — 10 — — — 20 — — — 30 $ 5 $ 5 $ 5 L , Units of labor per year
Managerial Economics, Lecture 11: Costs Properties of Isocost Lines • The intercepts depend on factor prices. • intersects capital axis at • intersects labor axis at • Isocosts farther from origin involve higher costs. • The slope of each isocost line is the same. • As with a budget line, the slope is the price of the factor on the horizontal axis divided by the price of the factor on the vertical axis. • That is, slope = K/L = -w/r
Managerial Economics, Lecture 11: Costs Minimizing Costs • To pick lowest-cost combination of inputs to produce a given level of output when isoquants are smooth: • Pick the lowest possible isocost line that touches the relevant isoquant. • The isocost and isoquant lines are tangent at this point, that is, MRTS = w/r
Managerial Economics, Lecture 11: Costs Figure 7.5 Cost minimization for Norwegian printing firm K , Units of q = 100 isoquant capital per year 3,000-kr isocost y 303 2,000-kr isocost 1,000-kr isocost x 100 z 28 0 24 50 116 L , Units of labor per year
Managerial Economics, Lecture 11: Costs Last Dollar Rule • As in the case of utility maximization, this analysis leads to a last dollar rule: make sure the last dollar spent on one input produces as much extra output as last dollar spent on any other input
Managerial Economics, Lecture 11: Costs Cost Minimizing vs. Output Maximizing • With smooth isoquants: firm determines best factor proportions by either • Minimizing cost: what is the lowest cost, C*, at which the firm can produce output q*? • Maximizing output: What is the most output, q*, that can be produced at cost C*?
Managerial Economics, Lecture 11: Costs Long-Run Cost • Examine the lowest-cost factor combination for various levels of output • Define the expansion path: • Defined by cost-minimizing combination of labor and capital for each output level • The curve through tangency points is LR expansion path • The expansion path shows same relationship between LR cost and output as the LR cost curve.
Managerial Economics, Lecture 11: Costs Figure 7.7a Expansion Path and Long-Run cost Curve (a) Expansion Path K , Units of capital per year 4,000-kr isocost 3,000-kr isocost Expansion path 2,000-kr isocost z 200 y 150 x 100 200 isoquant 150 isoquant 100 isoquant 0 50 75 100 L , Workers per year
Managerial Economics, Lecture 11: Costs Figure 7.7b Expansion Path and Long-Run cost Curve (b) Long-Run Cost Curve Long-run cost curve C , Cost, kroner 4,000 Z 3,000 Y 2,000 X 0 100 150 200 q , Units per year
Managerial Economics, Lecture 11: Costs Shape of LR Cost Curves • Short-run: • SR AC initially downward sloping because AFC is downward sloping • SR AC later upward sloping because of diminishing returns • Long-run • No fixed cost in LR (usually) • Shape of cost curves determined by production function returns to scale.
Managerial Economics, Lecture 11: Costs (a) Cost Curve Cost, $ C Figure 7.8 Long-Run Cost Curves q * q , Quantity per day (b) Marginal and Average Cost Curves Cost per MC unit, $ AC q * q , Quantity per day
Managerial Economics, Lecture 11: Costs Economies of Scale
Managerial Economics, Lecture 11: Costs Long-Run & Short-Run Cost Curves • In LR, firm chooses optimal plant size to minimize its LR cost for a given q • Because the firm cannot vary its capital in SR but can in LR • SR cost LR cost • SR cost > LR cost if the "wrong" level of capital is used in SR
Managerial Economics, Lecture 11: Costs Figure 7.9 Long-Run Average Cost as the Envelope of Short-Run Average Cost Curves Average cost, $ LRAC 3 SRAC 2 SRAC 1 3 SRAC SRAC b 12 d 10 a c e 0 q q q , Output per day 1 2
Managerial Economics, Lecture 11: Costs Long-Run Cost Curves in Printing Cost, kroner 40 1 SRAC 2 SRMC 1 SRMC 30 2 SRAC 20 = LRAC LRMC 10 0 200 600 1,200 q , Output per year
Managerial Economics, Lecture 11: Costs Long-Run Cost Curves Oil Pipelines Cost per barrel-mile 150 100 8 " SRAC 10 " SRAC 12 " SRAC 50 16 " SRAC 20 SRAC " 26 " SRAC SRAC " 40 10 LRAC 0 10 20 40 100 200 400 1000 2000 Thousand barrels per day