INFO2005 Requirements Analysis Activity Diagrams
260 likes | 454 Vues
INFO2005 Requirements Analysis Activity Diagrams. Department of Information Systems. Learning Objectives. Identify the need for activity modelling UML notation for activity diagrams Examine the use of activity diagrams in the Rational Unified Process. Activity Modelling.

INFO2005 Requirements Analysis Activity Diagrams
E N D
Presentation Transcript
INFO2005Requirements AnalysisActivity Diagrams Department of Information Systems
Learning Objectives • Identify the need for activity modelling • UML notation for activity diagrams • Examine the use of activity diagrams in the Rational Unified Process.
Activity Modelling • Computer systems and the commercial / work environments in which they are used comprise may activities • business activities performed by people • activities performed with the information system by software • activities performed by machines under computer control
Activity Modelling • Business processes are typically captured in use cases • Computer procedures are embodied in operations (analysis) and the methods (design and construction) that implement them. (Note that objects collaborate to realize a use case).
Dynamic Modelling • Activity diagrams are one of the five modelling techniques in UML that capture the dynamics of the system • The others are
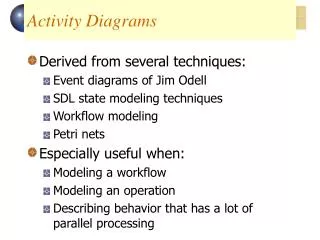
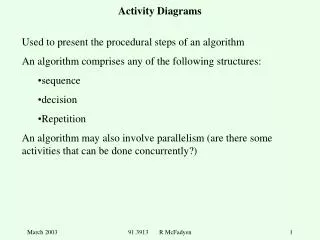
Activity Diagrams • An activity diagram represents the a series of actions in sequence. • Activity diagrams are essentially flowcharts, rather similar in format to system flowcharts though used in a somewhat different way.
Activity Diagram - notation Activity diagram for calculateBonus() operation Bennett, McRobb, Farmer 1999
Notation • An action state is normally used to model a step in the execution of an algorithm or procedure • When an action state ends the next action state (depending upon guard conditions) executes.
Notation • Transitions show the sequence of the actions. These transitions are completion transitions. • Guard conditions are used represent conditional paths of execution.
Notation • A thread of execution with a guard condition is only executed if the condition is satisfied. • Decisions and guard conditions are used to show alternate threads.
Activity Diagram - nested decisions Nested decisions can be used to represent complex conditions Bennett, McRobb, Farmer 1999
Concurrent threads • Concurrent threads can be shown by using synchronization bars. • A synchronization bar shows the start (fork) or end (join) of a group of parallel subflows.
Fill kettle with Find tea bag Find cup water Boil water in Place tea bag kettle in cup [milk required] Add water to Add milk cup [no milk required] Bennett, McRobb, Farmer 1999
* Example: Enrolment • Prepare an activity diagram for student enrolment • Typical activities might be • Prepare registration documentation • Arrange enrolment session • Enrol student at the beginning of the academic year • Complete enrolment form • Send joining instructions to student
Object flows • Object flows are used to show how objects involved in a workflow, procedure or algorithm. • An object may be the output of an activity and the input activities. • Object flow is a kind of control flow which it replaces. • The object flow symbol shows an object in a particular state.
Swimlanes Object flow Note that the object changes state Bennett, McRobb, Farmer 1999
Swimlanes • An activity diagram may be partitioned into swimlanes. • Each swimlanes represents a particular responsibility for some of the action states. • The responsibilities may be allocated to a person, a part of an organisation, or a set of classes.
* Example: Enrolment • Redraw the activity diagram with swimlanes. • possible participants with responsibilities could be Registry, Faculty and Student.
Registry Faculty Student *
Where are activity diagrams used? • Activity diagrams can be used for a number of different purposes: • to model a human task • to describe a system function that is represented by a use case; • to describe the logic of an operation. Bennett, McRobb, Farmer 1999
Activity diagram & BOM • Describes the ordering of activities or tasks that accomplish business goals. • Activity diagrams help
Business Use Case Model • A business use case typically involves a workflow that produces some benefit for the business actor. • Activity diagrams are used to describe the structure of workflows
Activity diagrams & Use Cases • The flow of events of a use case describes the sequence of activities that together produce the value for an actor. • An activity diagram can be used to describe the flow of events of a use case.
Summary • Identify the need for activity modelling • UML notation for activity diagrams • Examine the use of activity diagrams in the Rational Unified Process
References • Bennett, S. et. al. (2002)“Object-Oriented Systems Analysis & Design using UML” McGraw-Hill, Maidenhead. • OMG (1999) “Unified Modeling Language Specification,version 1.3” • Rational Unified Process 2000