Download
1 / 29
360 likes | 648 Vues
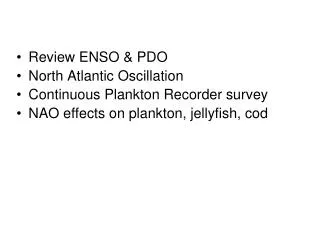
Review ENSO & PDO North Atlantic Oscillation Continuous Plankton Recorder survey NAO effects on plankton, jellyfish, cod. El Niño = ENSO warm event La Niña = ENSO cool event. Pacific Decadal Oscillation (PDO). Positive/warm PDO phase Negative/cool PDO phase. ENSO events:

E N D
Review ENSO & PDO • North Atlantic Oscillation • Continuous Plankton Recorder survey • NAO effects on plankton, jellyfish, cod
El Niño = ENSO warm event La Niña = ENSO cool event Pacific Decadal Oscillation (PDO) Positive/warm PDO phase Negative/cool PDO phase ENSO events: 6-18 month duration 2-8 year frequency ENSO index is based on sea level but has characteristic temperature pattern (Walker circulation affects location and extent of Pacific warm pool) PDO cycle: 15-30 year phase (low-frequency oscillation) PDO index is based on patterns of temperature anomaly but has sea level patterns like those of ENSO
North Atlantic Oscillation (NAO) NAO index: winter average anomaly of sea-level air pressure at Reykjavik minus Lisbon. No correction for climate change.
Positive NAO • Positive NAO index phase shows a stronger than usual subtropical high pressure center and a deeper than normal Icelandic low. • The increased pressure difference results in more and stronger winter storms crossing the Atlantic Ocean on a more northerly track. • This results in warm and wet winters in Europe and in cold and dry winters in northern Canada and Greenland • The eastern US experiences mild and wet winter conditions • Ocean winds are stronger • Winter is warm and rainy in Eastern US & Northern Europe
Negative NAO • Negative NAO index phase shows a weak subtropical high and a weak Icelandic low. • The reduced pressure gradient results in fewer and weaker winter storms crossing on a more west-east pathway. • Storms bring moist air into the Mediterranean and cold air to northern Europe • The US east coast experiences more cold air outbreaks and hence snowy weather conditions. • Greenland, however, will have milder winter temperatures • Ocean winds are weaker • Winter is colder & snowier in US and N. Europe
North Atlantic Oscillation Index Normalized NAO Index (winter) Year Long periods of +/- NAO phases started mid-20th century Beginning early 1970’s, a >30-year mostly positive phase
United Kingdom, Jan. 2010 In 2009/2010 the winter NAO index reached a 30-year low. That winter was much colder and snowier than normal in Northern Europe. There were many deaths, power failures, transportation disruptions, and postponed soccer games. Barcelona, March 2010
Recent NAO Index - how will the winter be? Mild & rainy? Cold & snowy? http://www.cpc.ncep.noaa.gov/products/precip/CWlink/pna/nao.shtml
+ NAO produces higher temperatures and more precipitation in N. Europe and US East coast The maps at left show the relationships between a strong positive NAO and precipitation and temperature. (Images courtesy Lamont-Doherty Earth Observatory)
Winter surface temperature anomaly Correlation of winter temperature and NAO Visbeck, et al., 2001
Long-term plankton data in Atlantic from Continuous Plankton Recorder (CPR) Operated by Sir Alister Hardy Foundation for Ocean Science (SAHFOS) in United Kingdom McGowan 1990
Cargo ships • CPR is towed behind many different ships • Opportunistic sampling of the North Sea and North Atlantic since 1931 Passenger ferries Greenpeace Research vessels Containerships
NAO negatively affects plankton biomass -NAO +NAO -NAO +NAO Problem: averages are taken over entire sampling region, including some areas where T and NAO are negatively correlated. McGowan 1990
CPR data on zooplankton abundance 1950-1970: mostly negative NAO 1970-2000: mostly positive NAO After 1970, zooplankton abundance declines and is seasonally compressed. McGowan 1990
Spatial effects of NAO can be seen in copepod distributions. Next slides show data from cool (-) phase and warm (+) phase Cool (-) Warm (+) Normalized NAO Index (winter) Year
Cool (-NAO) Warm (+NAO) Beaugrand et al. 2002
Geographic pattern of effect of NAO on sea surface temperature North Sea -strongest positive correlation
Frequency of Jellyfish in CPR samples Is positively related to NAO index NAO Index Attrill et al. 2007
Jellyfish frequency significantly correlated with NAO and Atlantic inflow Mean annual inflow from Atlantic to North Sea (Sv)
Cod life cycle (~13 to 25-year life span) Spawning aggregations form in deep water, late winter to spring Planktonic eggs drift in currents Larvae hatch, develop, eat progressively larger plankton Reach maturity at 2-8 years Grow to 6 feet long
North Sea cod in state of collapseSome stocks <1% of numbers in 70’s
Several major cod stocks in North Atlantic Barents Sea North Sea Georges Bank
Redsymbolsindicate strength and sign of effect of NAO on cod recruitment +Barents Sea -Georges Bank
NAO positively related to cod recruitment in Barents Sea Start here, read clockwise Log(abundance age 3 1000s) temperature NAO index NAO index Length 1/2 year old cod Log(abundance age 3 1000s) Length 1/2 year old cod (mm) temperature Otterson et al. 2001
Georges Bank NAO - Plankton - Cod 90 -4 -2 NAOdt Plankton Volume 50 0 2 10 70 75 80 85 90 95 -4 -1.0 NAOdt -2 Cod Index 0 -1.5 2 70 75 80 85 90 95 Year Plankton Volume and Cod Survival negatively correlated with NAO (Fogarty and Haidvogel)
ENSO vs. PDO vs. NAO • PacificOcean: temperature anomaly patterns are similar during El Niño (an ENSO warm event) and during a positive/warm cycle of the Pacific Decadal Oscillation. Patterns are similar during La Niña (an ENSO cool event) and during a negative/cool cycle of the Pacific Decadal Oscillation. ENSO and PDO effects are additive. • ENSO and PDO differ mainly in time scale. El Niño’s happen every 2 to 8 years and last only 6 to 18 months. The Pacific Decadal Oscillation can remain in one phase (warm or cool) for 15 to 30 years. • Atlantic Ocean: North Atlantic Oscillation (NAO) dominates. Oscillations have long time scales but are less regular than PDO. Effects on marine biology are not straightforward.
How to interpret all this information? • Long term climate cycles affect temperature, nutrients, stratification • Oceanographic response to climate oscillations is less well characterized in Atlantic than in Pacific • Biological response depends on trophic level and species characteristics • Most ecosystem effects can be understood in terms of mixed layer dynamics and regular seasonal cycles • Things can become clearer by considering the effects of long-term climate change on marine ecosystems (November-December)