Download
1 / 107
1.08k likes | 1.28k Vues
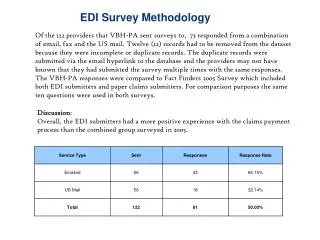
Review of Survey Methodology . Bradley A. Woodruff, MD MPH International Emergency and Refugee Health Branch, U.S. Centers for Disease Control and Prevention. SUMBER: www.smartindicators.org/.../B%20Woodruff%207-23%20Review%20of... . Review of Survey Methodology.

E N D
Review of Survey Methodology Bradley A. Woodruff, MD MPH International Emergency and Refugee Health Branch, U.S. Centers for Disease Control and Prevention SUMBER: www.smartindicators.org/.../B%20Woodruff%207-23%20Review%20of...
Review of Survey Methodology • Review some basic principles in surveys and sampling • Describe some issues which • Often done incorrectly or inefficiently • Remain without strong consensus • Opinions expressed are only my own • Given to provide basis of discussion • Recommendations are strictly personal and not meant to be adopted by this meeting SUMBER: www.smartindicators.org/.../B%20Woodruff%207-23%20Review%20of...
Review of Survey Methodology • When to use surveys • Sampling methods • Final sampling stage (in multistage sampling) • Sample size • Number of clusters • Select 1 or all eligible persons? • Judging age eligibility • Children <6 months of age • Measuring mortality • High mortality and low malnutrition SUMBER: www.smartindicators.org/.../B%20Woodruff%207-23%20Review%20of...
When to use surveys SUMBER: www.smartindicators.org/.../B%20Woodruff%207-23%20Review%20of...
When to use surveys A cross-sectional survey is a collection of data from a specific population at a single point in time. SUMBER: www.smartindicators.org/.../B%20Woodruff%207-23%20Review%20of...
When to use surveys SUMBER: www.smartindicators.org/.../B%20Woodruff%207-23%20Review%20of...
When to use surveys Alternate data collection methods • Morbidity and mortality surveillance • Birth and death registration • Qualitative methods • Program data • Others SUMBER: www.smartindicators.org/.../B%20Woodruff%207-23%20Review%20of...
When to use surveys What a single survey can tell you • The point prevalence of health or nutrition outcome • Retrospective measure of cumulative incidence, such as mortality rates • Can assess outcomes when other data collection systems absent or impossible SUMBER: www.smartindicators.org/.../B%20Woodruff%207-23%20Review%20of...
When to use surveys What a single survey cannot tell you • Cause-effect relationships • Why events occur or why things are the way they are • Trends over time • However, repeated surveys can measure change SUMBER: www.smartindicators.org/.../B%20Woodruff%207-23%20Review%20of...
When to use surveys Purposes of a survey • Determine need for new program • Design new program • Evaluate existing program SUMBER: www.smartindicators.org/.../B%20Woodruff%207-23%20Review%20of...
Strengths of surveys Can give reasonably accurate estimate of prevalence of health condition in population Can be replicated to evaluate health outcomes Can be done when other data collection systems (e.g. surveillance) not feasible Weaknesses of surveys Difficult to assess cause/effect Often confined to short, simple questions Difficult to answer “why” questions Must be repeated to follow trends over time Sometimes difficult to define population of interest Sampling can be complex and is often not done well When to use surveys SUMBER: www.smartindicators.org/.../B%20Woodruff%207-23%20Review%20of...
When to use surveys • Surveys cost money, manpower, and time • Collect only data useful for program purposes • If primary objective is measuring malnutrition prevalence or mortality rate • Do not add extraneous data collection • However, large part of resources spent in traveling to selected households SUMBER: www.smartindicators.org/.../B%20Woodruff%207-23%20Review%20of...
When to use surveys – and where? • National-level data • Requires only one survey for country • Provides overall picture • Can serve as general assessment of nutritional status • NGOs often work on local level • Local data needed for program decisions • Difficult to formulate overall picture from many local surveys • Lack of standardization inhibits comparison • Difficult to achieve good coverage SUMBER: www.smartindicators.org/.../B%20Woodruff%207-23%20Review%20of...
When to use surveys - recommendations • Before beginning preparations • Carefully consider if survey necessary before beginning • Identify specific uses of survey results • Design survey to answer specific questions • Rigidly follow correct sampling procedures SUMBER: www.smartindicators.org/.../B%20Woodruff%207-23%20Review%20of...
Sampling methods SUMBER: www.smartindicators.org/.../B%20Woodruff%207-23%20Review%20of...
Sampling methods • The goal of sampling is to estimate some measure in the larger population. • Probability sampling: A selection of elements in a population, such that every element has a known, non-zero probability of being selected.* * Last, Dictionary of Epidemiology SUMBER: www.smartindicators.org/.../B%20Woodruff%207-23%20Review%20of...
Sampling methods - definitions • Sampling universe • Sampling frame • Sampling unit • Basic sampling unit or elementary unit • Sampling fraction • Respondent • Survey subject • Unit of analysis SUMBER: www.smartindicators.org/.../B%20Woodruff%207-23%20Review%20of...
Sampling methods – simple and systematic sampling • Simple random sampling • Most basic type of sampling • Statistical theory based on SRS • Calculate p values and confidence limits • Output from most statistics computer programs assume SRS • Selection of units is random and independent • Systematic random sampling • Similar to simple random sampling • First sampling unit chosen randomly • Systematic selection of subsequent units • Statistics same as simple random sampling SUMBER: www.smartindicators.org/.../B%20Woodruff%207-23%20Review%20of...
Sampling methods – simple and systematic sampling Both simple and systematic random sampling require a complete list of all sampling units in sampling universe OR that sampling units be organized to allow systematic selection SUMBER: www.smartindicators.org/.../B%20Woodruff%207-23%20Review%20of...
Sampling methods – cluster sampling Cluster sampling is probability sampling in which sampling units at some point in the selection process are collections, or clusters, of population elements* * Kalsbeek, Introduction to survey sampling SUMBER: www.smartindicators.org/.../B%20Woodruff%207-23%20Review%20of...
Sampling methods – cluster sampling • Is almost always multistage • Randomly choose geographic areas as primary sampling units • Selection is probability proportional to size • Final stage of sampling – choose basic sampling unite (For example, households or children) SUMBER: www.smartindicators.org/.../B%20Woodruff%207-23%20Review%20of...
Advantages Cheaper - basic sampling units closer together Does not need complete list of basic sampling units Disadvantages Decreased precision of estimate Calculation of p values and confidence limits more complicated Sampling methods – cluster sampling SUMBER: www.smartindicators.org/.../B%20Woodruff%207-23%20Review%20of...
Sampling methods – cluster sampling Stage 1 Stage 2 Stage 3 SUMBER: www.smartindicators.org/.../B%20Woodruff%207-23%20Review%20of...
District: A B D F C E PPS 231 912 3,099 376 484 763 Not PPS 231 912 3,099 376 484 763 Sampling methods – cluster sampling Sampling probability proportional to size SUMBER: www.smartindicators.org/.../B%20Woodruff%207-23%20Review%20of...
Sampling methods – cluster sampling SUMBER: www.smartindicators.org/.../B%20Woodruff%207-23%20Review%20of...
Sampling methods – cluster sampling SUMBER: www.smartindicators.org/.../B%20Woodruff%207-23%20Review%20of...
Cluster sampling – probability of selection 30 clusters of 15 households each Probability of selecting subdistrict within selected district Probability of selecting HH within selected subdistrict Total probability of selecting any HH in country Probability of selecting district 30 x Number of HHs in district ——————— Number of HHs in country Number of HHs in subdistrict ——————— Number of HHs in district 30 x 15 —————— Number of HHs in country 15 —————— Number of HHs in subdistrict x x = SUMBER: www.smartindicators.org/.../B%20Woodruff%207-23%20Review%20of...
Sampling methods – recommendations • Choose sampling method appropriate to availability and organization of data on population • Use simple or systematic random sampling when possible if logistic savings from cluster sampling not important • Most refugee camps are small enough to so that cluster sampling offers little logistic advantage • For cluster sampling, always sample probability proportional to size in all but the last sampling stage SUMBER: www.smartindicators.org/.../B%20Woodruff%207-23%20Review%20of...
Final sampling stage SUMBER: www.smartindicators.org/.../B%20Woodruff%207-23%20Review%20of...
Final sampling stage – EPI method EPI (bottle spinning) method of selecting households SUMBER: www.smartindicators.org/.../B%20Woodruff%207-23%20Review%20of...
Final sampling stage – EPI method • Simple • Widely known • Easy to train • Results in biased sample SUMBER: www.smartindicators.org/.../B%20Woodruff%207-23%20Review%20of...
Final sampling stage – selecting households EPI (bottle spinning) method of selecting households 10 9 5 3 4 7 8 6 2 1 SUMBER: www.smartindicators.org/.../B%20Woodruff%207-23%20Review%20of...
Final sampling stage – selecting households EPI (bottle spinning) method of selecting households 1 2 3 SUMBER: www.smartindicators.org/.../B%20Woodruff%207-23%20Review%20of...
Final sampling stage – selecting households EPI (bottle spinning) method of selecting households 10 9 5 3 4 7 8 6 2 1 SUMBER: www.smartindicators.org/.../B%20Woodruff%207-23%20Review%20of...
Final sampling stage – alternate methods • Less simple • Not as widely known • Requires somewhat more training • Results in less-biased sample SUMBER: www.smartindicators.org/.../B%20Woodruff%207-23%20Review%20of...
Final sampling stage – selecting households Map and dart throw method of selecting households SUMBER: www.smartindicators.org/.../B%20Woodruff%207-23%20Review%20of...
Final sampling stage – selecting households Segmentation method of selecting households 1 2 3 6 4 5 SUMBER: www.smartindicators.org/.../B%20Woodruff%207-23%20Review%20of...
Final sampling stage – selecting households Simple or systematic random selection of households 27 5 1 22 6 2 17 28 23 11 18 7 12 24 19 13 8 15 25 3 14 20 9 16 29 4 26 30 21 10 SUMBER: www.smartindicators.org/.../B%20Woodruff%207-23%20Review%20of...
Final sampling stage - recommendations • Do not use EPI method • Continue sampling stages until reach small enough area to do alternate method • Map and segment or list, then do simple or systematic random sampling SUMBER: www.smartindicators.org/.../B%20Woodruff%207-23%20Review%20of...
Sample size SUMBER: www.smartindicators.org/.../B%20Woodruff%207-23%20Review%20of...
Sample size To estimate sample size for single survey using simple or systematic random sampling, need to know: • Estimate of the prevalence of the outcome • Precision desired • Design effect • Size of total population • Level of confidence (always use 95%) SUMBER: www.smartindicators.org/.../B%20Woodruff%207-23%20Review%20of...
Sample size SUMBER: www.smartindicators.org/.../B%20Woodruff%207-23%20Review%20of...
Sample size SUMBER: www.smartindicators.org/.../B%20Woodruff%207-23%20Review%20of...
Sample size SUMBER: www.smartindicators.org/.../B%20Woodruff%207-23%20Review%20of...
Sample size As long as the target population is more than a few thousand people, you do not need to consider it in the sample size. You do NOT generally need a larger sample size if the population is bigger. SUMBER: www.smartindicators.org/.../B%20Woodruff%207-23%20Review%20of...
Sample size Where do get information to make assumption about prevalence? • Prior surveys • Qualitative estimates • Wild guesses • Err toward a prevalence of 50% SUMBER: www.smartindicators.org/.../B%20Woodruff%207-23%20Review%20of...
Sample size SUMBER: www.smartindicators.org/.../B%20Woodruff%207-23%20Review%20of...
Sampling – Sample size To estimate prevalence with 95% confidence limit and simple or systematic random sampling: N = 1.962 x (P)(1-P) d2 1.96 = Z value for p = 0.05 or 95% confidence limits P = Estimated prevalence d = Desired precision (for example, 0.05 for ± 5%) SUMBER: www.smartindicators.org/.../B%20Woodruff%207-23%20Review%20of...
Cluster sampling To estimate prevalence with 95% confidence limit and cluster sampling: N = DEFF x 1.962 x (P)(1-P) d2 DEFF = Design effect 1.96 = Z value for p = 0.05 or 95% confidence limits P = Estimated prevalence d = Desired precision (for example, 0.05 for ± 5%) SUMBER: www.smartindicators.org/.../B%20Woodruff%207-23%20Review%20of...
Sample size Examples of design effect for wasting: • Mongolia 1.3 • Badghis Province, Afghanistan 1.6 • Sar-i-Pul Camp, Afghanistan 1.4 • Mazar-i-Sharif, Afghanistan 2.0 Source: Mongolia MOH/CDC; UNICEF/CDC; MSF-B; ACF SUMBER: www.smartindicators.org/.../B%20Woodruff%207-23%20Review%20of...