Download
1 / 16
160 likes | 370 Vues
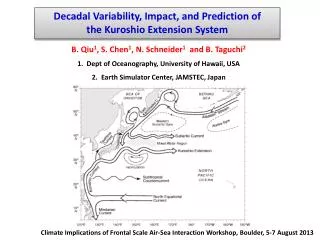
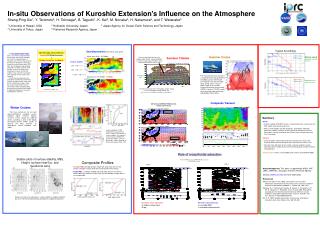
Intensive observations over the Kuroshio Extension front in the Baiu season. Yoshimi Kawai (JAMSTEC) & Y. Tachibana, T. Miyama, A. Manda , S. Iizuka , M. Yoshioka, H. Nakamura 10:05-10:25, 5 Aug. 2013 Frontal Scale Air-Sea Interaction Workshop. Unique Observations in Our P roject.

E N D
Intensive observations over the Kuroshio Extension front in the Baiu season Yoshimi Kawai (JAMSTEC) & Y. Tachibana, T. Miyama, A. Manda, S. Iizuka, M. Yoshioka, H. Nakamura 10:05-10:25, 5 Aug. 2013 Frontal Scale Air-Sea Interaction Workshop
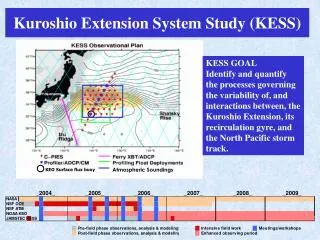
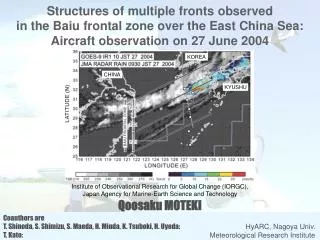
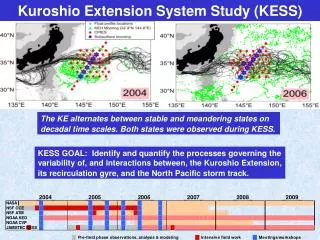
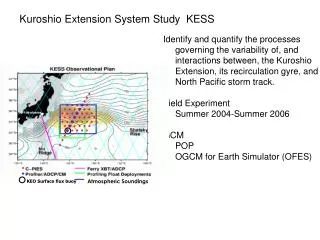
Unique Observations in Our Project 1) Three-vessel simultaneous observations across the KE front in the Baiu/Meiyu Season of 2012 2) Intensive observations across the Subarctic front in April 2013 3) Aircraft-vessel simultaneous observations across the KE front in July 2013
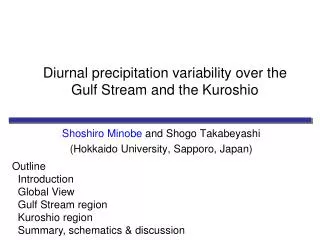
Why three vessels? • We need to clearly separate spatial distribution across the front from temporal variations Why Baiu/Meiyu season? • Relatively calm(if not, we have to escape!) • Response of low clouds on the SST front • Is the atmospheric response on SST really weak in summer?
Simultaneous observations (2-6 July) Seisui-maru Wakataka-maru Tansei-maru Microwave OISSTby RSS
Radiosonde diagram Seisui-maru Wakataka-maru 4hr Tansei-maru Every 2 hours
Calm condition throughout the observation period • It rained on 2 and 4 July
Surface wind speed Meridional wind speed southerly L L northerly Surface Air Temp. (SAT)
Latent heat flux and distance from the SST front South North
11:00-15:00, 2 July (JST) 15:00-19:00, 2 July (JST) 03:00-07:00, 3 July (JST) L Color: Relative humidity (%) Dot: cloud base height Cloud base height 03:00-15:00, 3 July Tanimoto et al. (2009)
Model experiments JCOPE2: 3D-VAR ocean reanalysis, 1/12º (by Dr. Miyazawa, JAMSTEC) Control JCOPE2 SST Obs. Smoothed JCOPE2 Smoothed SST on 3 July 2012
Cloud Liquid Water in CTL IPRC-RAM By Dr. Miyama WRF, nesting By Dr. Manda Red dot: observed cloud base height
SSTSmoothed IPRC-RAM By Dr. Miyama WRF, nesting By Dr. Manda Smoothed– Control Cloud Liquid Water SSTsmoothed → cloud height lowered south of the front
pref = pref ps ps’ Mean PVT during 0300-1900 on 3 July 0.3 hPa Reference height = 400m Δp =ps’-ps
Summary • We successfully observed fine structure of SST, air temperature, and cloud base height across the KE front • Turbulent heat flux showed clear meridional contrast, the maximum around 50 km away from the front. • Slope structure of cloud base height was observed • Regional models successfully simulated the slope structure of cloud base height across the front • Smoothed SST lowered cloud base height on the southern side, and reduced the gradient of cloud base • Direct effect of the front was limited within about 500 m height • Contribution of the differential heating to SLP was about 0.3 hPa in this case
For future studies • Does the horizontal difference in SLP of a few tenths hPa significantly affect synoptic-scale phenomena? • Can we capture evidence of the deep heating (Minobe et al., 2010) over the Kuroshio/KE by in situ observations? • Is the existing OI (or 3D-Var) SST enough for simulating frontal-scale atmospheric phenomena? • Model results depends on types of SST and lateral boundary condition