Download
1 / 34
340 likes | 468 Vues
Join our series of workshops designed to enhance knowledge on ozone measurement and quality control practices. The program includes sessions on QA systems, routine QC and data management, and audit processes, featuring experts like Mike Papp and Chris Ellis. Learn about the effects of meteorology on ozone formation, bias and precision calculations, and the intricacies of primary and transfer standards in ozone measurement. Gain insights on proper sampling and analytical techniques from industry professionals, ensuring your practices meet regulatory standards.

E N D
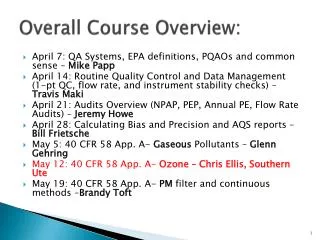
Overall Course Overview: • April 7: QA Systems, EPA definitions, PQAOs and common sense – Mike Papp • April 14: Routine Quality Control and Data Management (1-pt QC, flow rate, and instrument stability checks) – Travis Maki • April 21: Audits Overview (NPAP, PEP, Annual PE, Flow Rate Audits) – Jeremy Howe • April 28: Calculating Bias and Precision and AQS reports – Bill Frietsche • May 5: 40 CFR 58 App. A- Gaseous Pollutants – Glenn Gehring • May 12: 40 CFR 58 App. A- Ozone – Chris Ellis, Southern Ute • May 19: 40 CFR 58 App. A- PM filter and continuous methods –Brandy Toft
Ozone Monitoring Guest Speaker: Chris Ellis Southern Ute Indian Tribe
Ozone Formation Chemistry • NO + VOCs NO2 + O2 • NO2 + hv (sunlight) O + NO • O + O2 O3
Ozone is most efficient at absorbing light near the 254 nm wavelength. (We see about 400-800 nm, green being in the middle, 254 nm shorter than violet.) Sample gas fills the absorption tube (measurement cell) and ultraviolet light at near 254 nm is sent through the sample gas; how much gets absorbed by the ozone is measured to calculate ozone conc. Illustration is from Teledyne API 400E Operator’s manual One problem – other gases absorb at 254 nm– therefore scrubbers used
Think of the measurement as being divided into two steps……. Each measurement cycle is completed within 10 to 20 seconds. Each measurement contains two half cycles
Step 1: Measuring the “clean” air Thermo Electron/Thermo Environmental Instruments Models 49, 49C, 49i Automated Equivalent Method: EQOA-0880-047
The First Measurement Half Cycle Scrubber Sample Solenoid Absorption Tubes I0 Zero (reference) gas with the ozone “scrubbed”
UV Lampwith output concentrated at 253.7 nm where absorption of ozone is maximized
Summary: First Measurement Half-Cycle • Ambient (outside) air is sent thru the analyzer’s solenoid valve to the scrubber where any ozone present is converted to oxygen. • This ozone-free air is sent through the absorption tubes. • The UV source lamp shines on the air and the transmitted intensity (number of photons) is measured by the detector. • The analyzer stores this intensity value. I0
The MnO2 catalyzes the reaction of ozone to diatomic oxygen. • The air entering the absorption cell after passing through the filter is the same except for the ozone. Scrubber Cartridge copper screens coated with manganese dioxide
The Second Measurement Half Cycle Solenoid Sample Absorption Tubes I Sample without the ozone “scrubbed”
Summary: The Second Measurement Half-Cycle • airis directed to the absorption tubes. • The UV source lamp illuminates the air. • Any ozone in the airabsorbssome UV light resulting in a lower intensity value as measured by the detector. • The detector measures the transmitted intensity. • This value is subtracted from the previously stored value and the resulting difference is the amount of ozone in the ambient sample. I I – I0
Primary Standards • Located at a central laboratory where it can remain stationary, protected from the physical shocks of transportation, operated by an experienced analyst under optimum conditions. • Serves as a common standard for all analyzers in a network. • Compared against other primary standards • US EPA regions have primary standards, called SRPs, or standard reference photometers.
The Ozone Transfer Standard • Think of as two instruments: half makes ozone, the other half measures the sample. • Capable of generating and measuring accurate ozone concentrations. • Can be transportable but usually not • Critical Components of an Ozone Transfer Standard: • Zero air source • Pump • Flow controller • Ozone generator • Manifold
Ozone Scrubber Pump Analyzer To analyzer part of transfer standard Flow Controller capped Ozone Generator Manifold The Ozone Generator
The Ozone Generator • ultraviolet radiation (light) from a mercury vapor lamp shines on the incoming air. • The oxygen absorbs the UV light. • To dissipate the resulting gain in energy, the irradiated O2 molecules split into two negatively charged oxygen atoms. • These atoms combine with unsplit oxygen to form O3.
5 LPM The Manifold (connector) Capped 2 LPM for analyzer part of transfer standard 2 LPM + excess to analyzer
QC: Patience is a Virtue • Allow yourself enough time. • How fast you can do it means nothing. • If you rush you are bound to make mistakes. • Mistakes usually cost lost data, time and money. • The best operators take their time, are methodical and thorough.
All checks use the same statistic: Percent Difference ( di ) 1-pt QC (precision) checks: indicated- actual X 100 = Percent Difference actual Audit results: di
Installed in sampling “train” before the analyzer. • Will not degrade the ozone concentration. • QC before changing filters regularly-audits find dirty filters The .5 micron teflon® filter holder 0.5-micronTeflon® Filter Remember to change filter when dirty
Measurement Quality Objectives (MQOs) • EPA has ozone MQOs for NAAQS meas’s • Use these in element 7 of your QAPP • MQOs are in validation templates • Critical (any hour must be invalidated) • Operational (investigate, might still be okay) • Systematic (subsets might be invalid for NAAQS, but data might be valid for other purposes)
MQOs (validation template) • Critical: • 1-point QC check (used to be called precision) at least every 2 weeks conducted manually • <= +7% (percent difference) • Zero drift <= 2% of full scale (10 ppb away from zero if full scale is 500 ppb) • Span drift <= 7 % (e.g. near upper range of ambient levels should show analyzer value that “drifts,” or changes less than 7% from the last span output) • Hourly values before such checks fail should be invalidated (not deleted) back to the previous passing check
Operational criteria (investigate): • Shelter temp between 20 and 30 C • Annual audits should be within 15% of each audit concentration • NPAP audits should be within 10% for no warning per conc. • Verifications after moving, earthquakes should have all points within 2% of best-fit straight line • The local ozone standard that you compare against must be certified annually
Systematic criteria (some set of data maybe not comparable against NAAQS, but data may be usable for other purposes): • Completeness • Siting • Residence time • Probe material
Ozone Monitoring Conclusions: • NPAP auditing necessary for NAAQS data • Your instrument may be able to do “better” than validation criteria, see your spec sheets • Course website: http://itep68.itep.nau.edu/itep_downloads/QA101_Resources/ • Our emails: • Chris Ellis cellis@southern-ute.nsn.us • Melinda.ronca-battista@nau.edu • Christopher.lee@nau.edu