Download
1 / 31
310 likes | 334 Vues
Investigate natural biodegradation system in soil for designing efficient biological pretreatment technology for biofuel production. Project importance, background, experimental methodology, and results analysis provided.

E N D
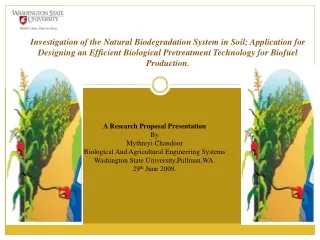
Investigation and modeling natural biodegradation system in soil; application for designing an efficient biological pretreatment technology for Biofuel production. Mythreyi Chandoor, Deepak Singh and Shulin Chen Bioprocessing and Bioproduct Engineering Laboratory, Department of Biological Systems Engineering Washington State University .
Agenda • Aim and importance of the project • Background – Hypothesis of the project • Experimental: • Microbiology • Chemical analysis of lignocellulose degradation in soil • Structural analysis • Modeling • Lignocellulose degradation in soil • Application • Acknowledgements
Aim and importance of the project • Demand for an Alternate fuel – • The U.S. ethanol consumption is forecast to increase from 5.6 billion gallons last year to 13.5 billion gallons in 2012, (Thomson Reuters, 2009). • What are the challenges ? • The greatest challenge lies in the deconstruction of lignin part of the biomass to release sugars. • Need for novel pretreatment technology !!
Background Natural biodegradation system in soil Hemicellulose Other complex compounds Cellulose Lignin Organic acids Metal Ions Microcosm Microcosm Degraded into smaller sub units. Chemically modified Amino acids Polyurinoids Humus
Background Lignocellulosic system in soil Proteins Delignification, repolymerization Humus formation in soil
Background Possible lignin mechanism in soil Lignin Microcosm Chemically modified/partially degraded Lignin Other complex compounds Organic acids Amino acids Polyurinoids Humus
Background Aim of the project • To understand the biodegradation of lignocellulose in soil • To model the biodegradation of lignocellulose in soil Design the pretreatment system
Experimental results • SEM (Scanning Electron Microscopy) • NMR(Solid State Nuclear Magnetic Resonance Spectroscopy) • 1-D NMR (Nuclear Magnetic Resonance Spectroscopy ) • TG (Thermogravimetric Analysis ) • FTIR (Fourier Transform Infrared Spectroscopy) • GC-MS (Gas Chromatography Mass Spectroscopy)
Solid State NMR Analysis C2,C3,C5 of cellulose 4 weeks 8 weeks 12 weeks 16 weeks Amorphous and crystalline compounds attached to C4 C4 of amorphous cellulose Phenolmethoxyl of coniferyl and sinapyl moities Aromatic carbons attached to methoxy groups in syringol unit
Solid State NMR Analysis • The amount of syringol and guaicol units of lignin have increased after 16 weeks • The Oxidation of syringyl and guaicyl units of lignin will give rise to syringol and guaicol units.
Solid State NMR Analysis Quantitatively , syringyl and guaicyl units have decreased where as the syringol and guaicol amounts have increased which shows that there is change in the chemical nature of lignin structure
Py-GC/MS Analysis % Concentration of the total compound Batch samples for every four weeks
Py-GC/MS Analysis • The Change in the lignin polymer is observed after the completion of 12 weeks. • The increase in the lignin content is attributed to the kind of subunits taken into consideration ; Syringol ,guaicol , ethanone and others were considered which are formed as a result of oxidation or modification of lignin.
Py-GC/MS Analysis Cellulose and Hemicellulose are proportionately decreasing while the lignin concentration is stable and increased after a period of 12 weeks
1H NMR analysis CONTROL δ3.81 Hα in β-structures 16 week SAMPLE δ3.81
1H NMR analysis • The signal at δ 3.81 ppm : methoxyl groups lower in sample.Indicates the enzymatic modification of the lignin molecules. • Signals in δ 4.39 ppm: Hγ in β-O-4 structures and β-5 structures and • Signals in δ 5.49 ppm : Hα in β-5 structures respectively.
1H NMR analysis • The low intensity of the protons in ß-O-4 unitswith biodegradation confirms the ß-O-4linkage degradation during the biological degradation process. • δ 6.93 ppm, δ 7.41 ppm, δ 7.53 ppm corresponding to • aromatic protons (certain vinyl protons), aromatic protons in benzaldehyde units and vinyl protons on the carbon atoms adjacent to aromatic rings in cinnamaldehyde units and aromatic protons in benzaldehyde units respectively were in low intensity in the 16 week samples.
TG Analysis After 20 weeks After 16 weeks After 12 weeks After 8 weeks After 4 weeks Soil Sample S5 Soil sample S4, 0 5 10 15 200 250 300 350 40 45 50 55 min Lignin Sugars
Modeling C02 Balance equation : dm CO2 /dt = (dmCO2bio/dt- mCO2 dvexhaust /dt )/v mCO2 = Mass of CO2 in soil dm CO2bio = evolution of CO2 during Bioreaction V= free space in the soil dvexhaust /dt = flow of exhaust air t = time dmCO2bio/dt = negligible ; The change in the flow of the exhaust air is also negligible dmCO2/dt = Negligible Therefore not being considered .
Modeling d(S1) / d(t) = -Vb1*S1*X1/(Ks1+S1) #Cellulose Balance S1(0) = 0.71 # weight in gm/gm d(S2) / d(t) = -Vb2*S2*X2/(Ks2+S2) #Hemicellulose Balance S2(0) = 0.48 # d(S3) / d(t) = -Vb3*S3*X3/(Ks3+S3) #Lignin Balance S3(0) = 0.28 #
Modeling µ=µmax1*S1/(Ks1+S1)-∆1 t(0) = 0 t(f) = 3360 µ2=µmax2*S2/(Ks2+S2)- ∆ 2 µ3=µmax3*S3/(KS3+S3)- ∆ 3 Considering the values as follows ; µmax1=0.08 µmax2=0.05 μmax3=0.03 ∆ 1=0.001 ∆ 2=0.001 ∆ 3=0.001 We derived an relation using polymath which defines the degradation pattern in the soil system.
Modeling Initial Substrate concentration in gm / gm Time (in hours )
Application of the model • The model developed is a relation drawn between the total initial concentrations of the cellulose, hemicellulose and lignin , defined in a specific proportion at any point of time . • Further ,the model would correlate the various factors involved parallel to the degradation rates of each component respectively.
Conclusion • Based on the different experiments conducted on the samples which were incubated for 4,8,12,16 and 20 weeks it has been observed that : • The optimized conditions for lignin modification is obtained after a period of 16 weeks . • These optimized conditions are in relation to various factors present in the soil system, with respect to the relative proportion of each component .
Conclusion The determination of the exact relation between these factors would be helpful in developing a model which would predict the specific ratio of cellulose, hemicellulose and lignin apart from other factors involved such as pH,temperature and other organic compounds. Thus providing a suitable mechanism for the pretreatment technology !!
I would like to thank • Dr. Ann Kennedy USDA-ARS Soil Scientist/ Adj. Prof. • Crop and Soil Sciences,WSU. • Dr. Greg Helms, NMR Center Director ,WSU. • Dr. Manuel Garcia-Perez. Assistant Professor / Scientist. • Biological Systems Engineering ,WSU. • Dr. Bill , Assistant manager ,NMR Center,WSU. • And my Advisor … • Dr.Shulin Chen, Professor/Scientist. • Department of Biological Systems Engineering,WSU .
And My Team … Acknowledgements Acknowledgements