Download
1 / 26
260 likes | 269 Vues
VERNOV Mission: First Results of TLE study in ultraviolet and infrared ranges of light spectrum. G.K. Garipov , M.I. Panasyuk , S.I.Svertilov, V.V.Bogomolov, V.O.Barinova, K.Yu.Saleev. Skobeltsyn Institute of Nuclear Physics, Moscow State University, Russia

E N D
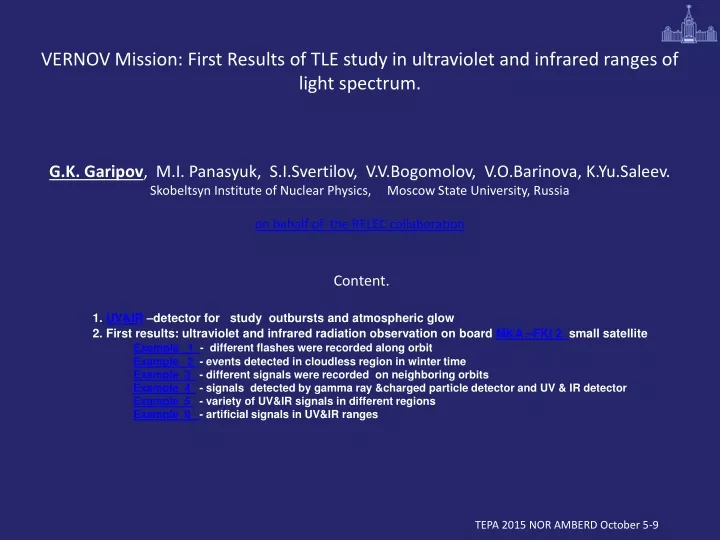
VERNOV Mission: First Results of TLE study in ultraviolet and infrared ranges of light spectrum. G.K. Garipov, M.I. Panasyuk, S.I.Svertilov, V.V.Bogomolov, V.O.Barinova,K.Yu.Saleev. Skobeltsyn Institute of Nuclear Physics, Moscow State University, Russia on behalf of the RELEC collaboration Content. 1. UV&IR –detector for study outbursts and atmospheric glow 2. First results: ultraviolet and infrared radiation observation on board MKA –FKI 2 small satellite Example 1 - different flashes were recorded along orbit Example 2 - events detected in cloudless region in winter time Example 3 - different signals were recorded on neighboring orbits Example 4 - signals detected by gamma ray &charged particle detector and UV & IR detector Example 5 - variety of UV&IR signals in different regions Example 6- artificial signals in UV&IR ranges TEPA 2015 NOR AMBERD October 5-9
The set of scientific payload for optical observation on-board “VERNOV” satellite, launched on the 8 of July 2014, measured transient (millisecond) flashes in the atmosphere in two wavelength bands: ultraviolet (240-400nm) and red-infrared (610-800nm). Global distribution of the flashes, their detection frequency, two band spectrum and time parameters are presented in this presentation. Transient flashes measured from the satellite were detected frequently in high latitudes in winter time. Flashes in near- equatorial region are observed as a ‘series’ which are stressed along magnetic meridian and some of them are detected in the cloudless regions. At the same time they are not detected above Sahara desert. ‘Series’ of the flashes detected above Africa on one of the orbits WWLLN
Examples of oscillograms of five different types of flashes detected in experiment 1 2 3 1- noise like low amplitude signals. 2- high latitudes flashes. 3- UV- blue flashes (UV/IR>10). 4 5 4 – UV & IR signals from lightning. 5- mixed UV&IR signals 6-artifical UV&IR luminescence from lightning and blue flash
Main goal of “VERNOV” (former “MKA-FKI”) scientific space mission is studying fluxes of relativistic electrons of burst type arising in thunderstorms or in the near Earth space environment and their relation to the short time atmospheric luminescence in optical, radio and gamma ray ranges in global and near Earth space. MKA-FKI2 satellite NORAD: 40070U Inter. ID: 14037B Launch.: 2014 .07.09 Period: 99.2 min. Revs/day: 14.5 Incl.: 98.4 degrees Apogee: 819 km Perigee: 621 km
1. Signal finding algorithm, which selects the brightest flashes every 5 seconds time interval. 2. Gain control algorithm for fixing PMT anode current across whole airglow range. 3.Interface algorithm for communication with the satellite board. 4.Waveform saving algorithm for storage waveforms of the flashes in digital form. DUV - detector UV – 240-400nm weigh– 0.5 kg IR – 610-800nm power consumption – 2.5W Sensitive - area 0.4cm2 gain control range – 106 Field of view ~ 200 waveform window amplitude range 4x10³ Full dynamic range- 4x 10⁹ nadir observation Maximum sensitivity -one photoelectron Example of selected signal oscillogram Block diagram of the detector (1) collimator, (2) UV-1 filter, (3) IR filter, MX-multiplexor , HV- PMT high voltage source,ADC and DAC—analog to digital and digital to analog convertors, Logic Unit-FPGA.
Example of amplitude distribution of different flashes along satellite ground track on the map, which were observed on the night side of the orbit from 82 degrees south latitude to 16 degrees north latitude during 30 minutes. Part of flashes were observed in winter time in South hemisphere. 5 4 3 2 1 1 – UV - IR lightning flashes signals. 2- UV- blue flashes, UV/IR>10. 3- light glow produced by SAA particles in detector optical parts 4- low value noise like signals. 5- high latitudes flashes
Example of events detected in cloudless region in winter time at the same time in the same region there were not detected thunderstorms WWLLN
Example of different signals recorded on night side during six neighboring orbits from the West coast of Africa to the East coast of Australia by UV & IR detector
Example of signal recorded to the south from the East coast of Africa and in the South of Indian Ocean by gamma ray & charged particles detectors and UV & IR detector
Example of some differences of the signals recorded in SAA and to the south from the East coast of Africa Signals in SAA have not clearly distinguishable peaks Signals to the East from South Coast of Africa have clearly distinguishable peaks in the presence of charged particles and gamma rays.
Co-executers 1.D.V.Skobeltsyn Institute of Nuclear Physics , M.V. Lomonosov State University, Russia (SINP MSU) 2.Space Research Institute, Russian Academy of Sciences, Russia (SRI RAS) 3.S.A.Lavochkin Scientific and Production Association., Russia (SPA) 4.Laboratory of Aero- Space Technology, Russia 5.Etvosh University, Hungary 6.Sungkyunkwan University (SKKU)., Seoul, Korea 7.Space Research Centrum, Poland Academy of Sciences, Poland 8.Lvov Center of Space Research Institute, Ukraine VERNOV (former MKA-FKI) scientific instrument principalinvestigator SINP MSUsatellite design with service units was made by SPA “S.A.Lavochkin” Science team leader -Mikhail Panasyuk.-SINP MSU Together with Sergey Svertilov – SINP MSU & Stanislav Klimov SRI RAS Speaker contribution to this work are designandmanufacturing UV and IR detector, development ofresearch methods, data processing and analysis NOR AMBERD TEPA 2015
mixed UV&IR signals from lightning and blue flash 1- lightning. 2- TLE
Example of distribution of amplitudes of five different types of 35 flashes detected on the night side of one orbit from 82 degrees south latitude to 16 degrees north latitude during 30 minutes 1 – UV - IR flashes from lightings. 2- UV- blue flashes (UV/IR>10), 3- light glow produced by SAA particles in detector optical parts 4- low altitude noise like signals. 5- high latitudes flashes
Thank you ! TEPA 2015 NOR AMBERD October 5-9