Download
1 / 23
230 likes | 253 Vues
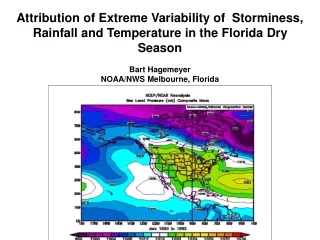
Explore the attribution and prediction of extreme weather events in Florida's dry season, including storminess, rainfall, and temperature. Consider the relationship to ENSO, PNA, AO, and NAO, and analyze logistic regression results. This research aims to assist decision-makers in understanding and preparing for extreme weather events.

E N D
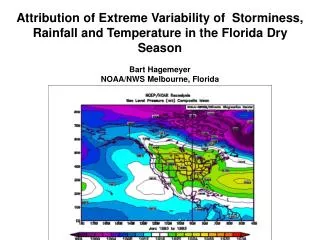
Attribution of Extreme Variability of Storminess, Rainfall and Temperature in the Florida Dry SeasonBart HagemeyerNOAA/NWS Melbourne, Florida
Consider Extreme Events in the Florida Dry Season • and their Relationship to ENSO, PNA, AO and NAO • Major Extratropical (ET) Storms • Severe Weather (Tornadoes) • Excessive Rainfall and Flooding • Drought and Wildfire • Severe Cold Outbreaks
Attribution of Extreme Variability • Extreme seasonal variability is often due to the occurrence • of a few extreme weather events. • Extreme impacts result from intersection of a extreme weather event with customer vulnerability. • Critical to relate climate to weather in a physically meaningful way. • The goal is to predict the probability of occurrence of extreme events on a seasonal basis from major teleconnections. • Examples will be given for severe weather, rainfall, and extreme cold • using logistic regression.
Logistic Regression • Probabilistic results for decision support • Customer Involvement in setting critical variables and exceedance • thresholds • Assists in calibrating teleconnection strength by impact to user • Results can help prioritize research on potential highest payoff Will look at examples of Florida and single station (Daytona Beach) logistic regression results Biggest Challenge – Database development for specific customer location and critical variable.
The Strength of the Jet Stream Over Florida is the Fundamental Relationship with ENSO that Controls Storminess La Nina El Nino Probability of FMA 250 mb U over Florida > 1 SD above normal given JFM Nino 3.4. Correlation of NOV-APR 250 mb Zonal wind with NOV-APR NINO 3.4
Major Dry Season ET Storms Are always Associated with Jet Stream Maxima! El Nino La Nina NOV-APR Probability <1SD/>1SD Florida Dry Season Storms Given Mean Season NINO 3
Take it a step further – Probability of Extreme Severe Weather - El Nino NOV-APR Probability of Frequent and Strong Florida Tornadoes Given Dry Season NINO 3.0 Strong Relationship – Is it Physically Realistic?
Simple conceptual consideration of the time and space scales relating to the attribution and predictability of various weather and climate phenomena.
Violent Dry Season Tornadoes Occur in the Warm Sector of ET Cyclones with Jet Stream Maxima Mean Tornado Outbreak Environment Vertical Profile of U Hagemeyer and Schmocker 1993 Florida Tornado Outbreak Mean F-Scale Has the highest correlation with Bulk Mean Environmental Wind. R2 = 0.74 Hagemeyer and Matney 1993 EL Nino doesn’t cause violent tornadoes in Florida it enables them!
Attribution of Tornado Deaths? NOV-APR 1979-2006 Probability of >1 Tornado Death in Florida Dry Season Given Mean NINO 3.0
63 dead in mobile homes in 97-98 and 06-07. El Nino greatly increases the odds for violent tornado outbreaks – high death tolls result where tornadoes intersect societal vulnerability. (84 deaths in 6 El Nino Dry Seasons) ~70-80% pre-1994 Code Around 5,000 Manufactured Home Parks and a Million Units Predominant housing type in many rural areas
Calibrating The Teleconnection for Decision Makers It does not take an extreme El Nino to skew the odds towards extreme Increase in storminess – a “Moderate” El Nino will do just fine.
Rainfall Extremes ENSO has the strongest relationship to Florida rainfall Only the strongest El Nino are locks for extreme wetness Not all La Nina’s are extremely dry – case in point 88-89 LR results – 06-07 El Nino Only ~40% of Very wet Nov-Apr Nino 3.0 on rainfall
Extreme Weather Event Example Unique Extreme Rainfall Concerns - Maximum daily rain in Daytona Beach in December > 1.5” or < 0.50” Predictor – Mean Dry Season NINO 3.0
Temperature Extremes ENSO Not Particularly Relevant to Extremesof Cold Temperature Arctic Oscillation NINO 3.4 No Skill P DAB FMA MIN T +/- 1 SD FMA AO P DAB FMA MIN T +/- 1 SD JFM 34 1950-2004 data
Extreme AO- Extreme AO+
Noteworthy Warmth in Winter 06-07 – Not El Nino! Monthly AO DEC-JAN Mean MSLP
Extreme Weather Event Example Probability of at Least One Devastating Freeze in Daytona Beach in DJF Arctic Oscillation NINO 3.4
Extreme Weather Event Example: Insight into ENSO Impacts vs. Anecdotes Cool – but not extreme - skillful Decision-Maker can choose relevance and critical thesholds! Extreme Cold – No Skill Probability of December Minimum Temperature at Daytona Beach < 32, <28. and <24 given dry season Nino 3.0
Generally Coldest in ENSO Neutral Years – NAO/AO Rule Extremes El Nino La Nina ENSO Weak - AO/NAO and PNA Dominate Critical Area for Research - Can’t Continue to “Blame” ENSO
Thank You bart.hagemeyer@noaa.gov