Download
1 / 1
10 likes | 118 Vues
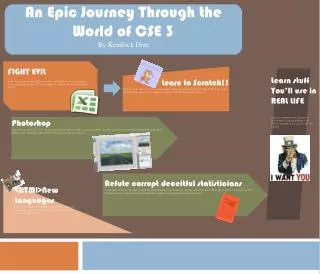
Throughout the quarter, I became computer literate by using various programs like MS Word, MS PowerPoint, MS Excel, Alice, HTML, and JavaScript. We created a calendar in HTML, working on visual and dynamic webpages. In Alice, I learned animation loops and developed a captivating story. Additionally, I formed a career plan using MS Word, which helped organize my future goals. Analyzing stock investments with MS Excel allowed me to visualize data and present findings in PowerPoint, enhancing my technical abilities and understanding of effective data communication.

E N D
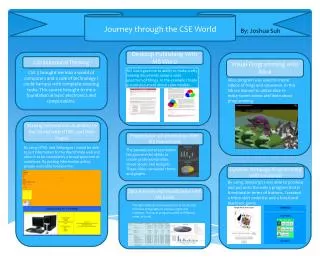
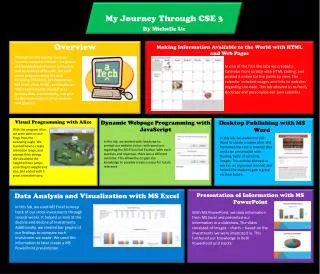
My Journey Through CSE 3 By Michelle Uc Overview Making Information Available to the World with HTML and Web Pages Throughout the quarter, students became computer literate – we gained the knowledge and to use computers and technology efficiently. We used many programs along the way including: MS Word, MS PowerPoint, MS Excel, Alice, HTML, and JavaScript. These technologies allowed us to process data, communicate, and gain further knowledge in office systems and graphics. In one of the first few labs we created a Calendar from scratch with HTML coding, and posted it online for the public to view. The calendar included images and links to websites regarding the date. This lab allowed us to freely decorate and personalize our own calendar. Visual Programming with Alice Dynamic Webpage Programming with JavaScript Desktop Publishing with MS Word With the program Alice, we were able to save frogs from the swooping eagle. We learned how to create animation loops, and prompt their doings. We calculated the height of their jumps according to weight and size, and ended with a great animated story. In this lab, we worked on MS Word to create a career plan. We formatted the text in manner that would be presentable with themes, table of contents, images. This activity allowed us work in an organized manner, and helped the students gain a grasp on their future. In this lab, we worked with JavaScript to prompt our website visitors with questions regarding the 2013 Sun God Festival. With each question and response, there was a different outcome. This allowed us to gain the knowledge to possibly create surveys for future reference. Data Analysis and Visualization with MS Excel Presentation of Information with MS PowerPoint In this lab, we used MS Excel to keep track of our stock investments through several weeks. It helped us look at the decline and decline of investments. Additionally, we created bar graphs of our findings to compare each investment we made. We used this information to later create a MS PowerPoint presentation. With MS PowerPoint, we took information from MS Excel and presented our information in a slideshow. The slides consisted of images – charts – based on the investments we were interested in. This furthered our knowledge in both PowerPoint and stocks.