Download
1 / 20
200 likes | 297 Vues
Explore insights into the genetic epidemiology processes, including defining phenotypes, familial aggregation, linkage analysis, and association studies. Discover how heritability analysis aids in estimating genetic contributions to traits and the significance of segregation analysis in determining inheritance patterns.

E N D
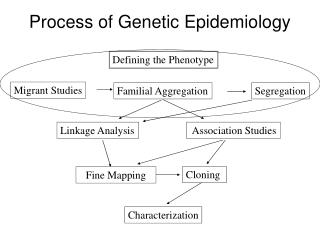
Process of Genetic Epidemiology Defining the Phenotype Migrant Studies Familial Aggregation Segregation Linkage Analysis Association Studies Cloning Fine Mapping Characterization
Familial Aggregation • Does the phenotype tend to run in families?
Recurrence (‘Familial’) Risk Ratios • Compares the probability a subject is affected given they have an affected family member to the population risk: lR = KR/K, where KR is the risk to relatives of type R K is the population risk lS = recurrence risk to siblings of probands versus the general population risk.
Recurrence Risk Ratios lR = P(Y2 = 1 |Y1 = 1) / K P(Y2=1|Y1=1)P(Y1=1) = P(Y2=1, Y1=1) P(Y2=1|Y1=1) = P(Y2=1, Y1=1)/P(Y1=1) K = P(Y1=1) lR = P(Y2=1, Y1=1)/P(Y1=1)2
Estimating RRR • With case-control data, calculate FRR as: Proportion of affected relatives of the cases (observed) / Proportion of affected relatives of controls (expected) (assumed to estimate K) • The higher the value of l, the stronger the genetic effect
Examples of s • Alzheimer Disease 3-4 • Rheumatoid Arthritis 12 • Schizophrenia 13 • Type I Diabetes 15 • Multiple Sclerosis 20-30 • Neural Tube Defects 25-50 • Autism 75-150
s versus GRR • How well does s estimate the genetic risk ratio? s = P(Y2=1|Y1=1) / P(Y2=1|Y1=0) ? P(Y2=1|D) / P(Y2=1|dd) = GRR Sibs disease not necessarily hereditary At risk individual may not have inherited D Sib unaffected doesn’t mean other sib doesn’t carry D
Heritability Analysis • Evaluates the genetic contribution to a trait Y in terms of variance explained. • Y = Genetics + Environment • Var(Y) = overall variation in phenotype Y = Var(G) + Var(E) + 2Cov(G,E) • Broad sense heritability: H2 = Var (G) / Var (Y) where Var(G) = genetic part of variance = VA+VD (Additive + Domince)
Narrow Sense Heritability • Proportion of phenotypic variance that is explained only by additive genetic effects: h2= VA/ Var (Y) A number of ways to estimate heritability. Commonly done with twin studies.
Twin Studies • Compare the phenotype correlation or disease concordance rates of MZ (identical) and DZ (fraternal) twins. Twin 1
MZ Twins (Identical) Twin 1 Both alleles are shared identical by descent (IBD) Twin 2
DZ Twins (Fraternal) Twin 1 Twin 2: any of the four IBD can be 2, 1, or 0 2 1 1 0
DZ Twins (Fraternal) Twin 1 Average sharing is 50% 100% 50% 50% 0%
IBD Sharing # of alleles shared IBD 2 1 0 Pr(2) Pr(1) Pr(0) Prop IBD Relationship Self, MZ twins 1 0 0 1 Parent, Offspring 0 1 0 1/2 Full siblings 1/4 1/2 1/4 1/2 Gr-child, Gr-prt 0 1/4 3/4 1/4 First cousins 0 1/4 3/4 1/8 Proportion of alleles shared IBD = # alleles x Pr(# alleles) / 2
Twin Studies • Assume MZ twins share all genes & envt., DZ share ½ genes & all envt. • Correlation among twins: rmz= VA+ VE rdz= ½ VA + VE where VE = common environment H2 = 2(rmz- rdz ) • Heritability ~ two times difference in correlation between MZ and DZ twins.
Example of Twin Study: PCa • Twin registry (Sweden, Denmark, and Finland) • 7,231 MZ and 13,769 DZ Twins (male) Heritability: 0.42 (0.29-0.50) Non-shared Environment: 0.58 (0.50-0.67) Lichtenstein et al NEJM 2000 13;343:78-85. Limitations of heritability calculations?
Segregation Analysis • Study families. • Estimate ‘mode of inheritance’ & what type of genetic variant might be causal. • Determine whether the disease appears to follow particular patterns across generations. • Estimate whether variants are rare or common, etc.
Segregation: Harry Potter’s Pedigree Muggle Wizard / Witch Vernon Dursley Lily Evans James Potter Petunia Dursley Harry Potter Dudley Dursley
Segregation Analysis • What is the best model of inheritance for observed families? • Dominant • Recessive • Additive • Disease allele frequency? • Magnitude of risk? • Fit formal genetic models to data on disease phenotypes of family members. • The parameters of the model are generally fitted finding the values that maximize the probability (likelihood) of the observed data. • This information is useful in parametric linkage analysis, which assumes a defined model of inheritance.