Exploring Archaea Domain & Gene Evolution
290 likes | 376 Vues
Discover Archaea domain's unique traits, relationship to eukaryotes, and evolutionary history. Dive into gene sequences and bioinformatics analyses to unveil genetic connections across species.

Exploring Archaea Domain & Gene Evolution
E N D
Presentation Transcript
Introduction to Bioinformatics Lecture 6 Substitution matrices
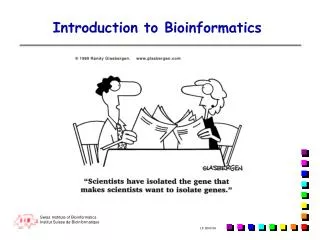
Sequence Analysis Finding relationships between genes and gene products of different species, including those at large evolutionary distances
Archaea Domain Archaea is mostly composed of cells that live in extreme environments. While they are able to live elsewhere, they are usually not found there because outside of extreme environments they are competitively excluded by other organisms. Species of the domain Archaea are not inhibited by antibiotics, lack peptidoglycan in their cell wall (unlike bacteria, which have this sugar/polypeptide compound), and can have branched carbon chains in their membrane lipids of the phospholipid bilayer. It is believed that Archaea are very similar to prokaryotes that inhabited the earth billions of years ago. It is also believed that eukaryotes evolved from Archaea, because they share many mRNA sequences, have similar RNA polymerases, and have introns. Therefore, it is believed that the domains Archaea and Bacteria branched from each other very early in history, and membrane infolding produced eukaryotic cells in the archaean branch approximately 1.7 billion years ago. There are three main groups of Archaea: extreme halophiles (salt), methanogens (methane producing anaerobes), and hyperthermophiles (e.g. living at temperatures >100º C!).
The 20 common amino acids
Example of sequence database entry for Genbank LOCUS DRODPPC 4001 bp INV 15-MAR-1990 DEFINITION D.melanogaster decapentaplegic gene complex (DPP-C), complete cds. ACCESSION M30116 KEYWORDS . SOURCE D.melanogaster, cDNA to mRNA. ORGANISM Drosophila melanogaster Eurkaryote; mitochondrial eukaryotes; Metazoa; Arthropoda; Tracheata; Insecta; Pterygota; Diptera; Brachycera; Muscomorpha; Ephydroidea; Drosophilidae; Drosophilia. REFERENCE 1 (bases 1 to 4001) AUTHORS Padgett, R.W., St Johnston, R.D. and Gelbart, W.M. TITLE A transcript from a Drosophila pattern gene predicts a protein homologous to the transforming growth factor-beta family JOURNAL Nature 325, 81-84 (1987) MEDLINE 87090408 COMMENT The initiation codon could be at either 1188-1190 or 1587-1589 FEATURES Location/Qualifiers source 1..4001 /organism=“Drosophila melanogaster” /db_xref=“taxon:7227” mRNA <1..3918 /gene=“dpp” /note=“decapentaplegic protein mRNA” /db_xref=“FlyBase:FBgn0000490” gene 1..4001 /note=“decapentaplegic” /gene=“dpp” /allele=“” /db_xref=“FlyBase:FBgn0000490” CDS 1188..2954 /gene=“dpp” /note=“decapentaplegic protein (1188 could be 1587)” /codon_start=1 /db_xref=“FlyBase:FBgn0000490” /db_xref=“PID:g157292” /translation=“MRAWLLLLAVLATFQTIVRVASTEDISQRFIAAIAPVAAHIPLA SASGSGSGRSGSRSVGASTSTALAKAFNPFSEPASFSDSDKSHRSKTNKKPSKSDANR …………………… LGYDAYYCHGKCPFPLADHFNSTNAVVQTLVNNMNPGKVPKACCVPTQLDSVAMLYL NDQSTBVVLKNYQEMTBBGCGCR” BASE COUNT 1170 a 1078 c 956 g 797 t ORIGIN 1 gtcgttcaac agcgctgatc gagtttaaat ctataccgaa atgagcggcg gaaagtgagc 61 cacttggcgt gaacccaaag ctttcgagga aaattctcgg acccccatat acaaatatcg 121 gaaaaagtat cgaacagttt cgcgacgcga agcgttaaga tcgcccaaag atctccgtgc 181 ggaaacaaag aaattgaggc actattaaga gattgttgtt gtgcgcgagt gtgtgtcttc 241 agctgggtgt gtggaatgtc aactgacggg ttgtaaaggg aaaccctgaa atccgaacgg 301 ccagccaaag caaataaagc tgtgaatacg aattaagtac aacaaacagt tactgaaaca 361 gatacagatt cggattcgaa tagagaaaca gatactggag atgcccccag aaacaattca 421 attgcaaata tagtgcgttg cgcgagtgcc agtggaaaaa tatgtggatt acctgcgaac 481 cgtccgccca aggagccgcc gggtgacagg tgtatccccc aggataccaa cccgagccca 541 gaccgagatc cacatccaga tcccgaccgc agggtgccag tgtgtcatgt gccgcggcat 601 accgaccgca gccacatcta ccgaccaggt gcgcctcgaa tgcggcaaca caattttcaa …………………………. 3841 aactgtataa acaaaacgta tgccctataa atatatgaat aactatctac atcgttatgc 3901 gttctaagct aagctcgaat aaatccgtac acgttaatta atctagaatc gtaagaccta 3961 acgcgtaagc tcagcatgtt ggataaatta atagaaacga g //
Example of sequence database entry for SWISS-PROT (now UNIPROT) ID DECA_DROME STANDARD; PRT; 588AA. AC P07713; DT 01-APR-1988 (REL. 07, CREATED) DT 01-APR-1988 (REL. 07, LAST SEQUENCE UPDATE) DT 01-FEB-1995 (REL. 31, LAST ANNOTATION UPDATE) DE DECAPENTAPLEGIC PROTEIN PRECURSOR (DPP-C PROTEIN). GN DPP. OS DROSOPHILA MELANOGASTER (FRUIT FLY). OC EUKARYOTA; METAZOA; ARTHROPODA; INSECTA; DIPTERA. RN [1] RP SEQUENCE FROM N.A. RM 87090408 RA PADGETT R.W., ST JOHNSTON R.D., GELBART W.M.; RL NATURE 325:81-84 (1987) RN [2] RP CHARACTERIZATION, AND SEQUENCE OF 457-476. RM 90258853 RA PANGANIBAN G.E.F., RASHKA K.E., NEITZEL M.D., HOFFMANN F.M.; RL MOL. CELL. BIOL. 10:2669-2677(1990). CC -!- FUNCTION: DPP IS REQUIRED FOR THE PROPER DEVELOPMENT OF THE CC EMBRYONIC DOORSAL HYPODERM, FOR VIABILITY OF LARVAE AND FOR CELL CC VIABILITY OF THE EPITHELIAL CELLS IN THE IMAGINAL DISKS. CC -!- SUBUNIT: HOMODIMER, DISULFIDE-LINKED. CC -!- SIMILARITY: TO OTHER GROWTH FACTORS OF THE TGF-BETA FAMILY. DR EMBL; M30116; DMDPPC. DR PIR; A26158; A26158. DR HSSP; P08112; 1TFG. DR FLYBASE; FBGN0000490; DPP. DR PROSITE; PS00250; TGF_BETA. KW GROWTH FACTOR; DIFFERENTIATION; SIGNAL. FT SIGNAL 1 ? POTENTIAL. FT PROPEP ? 456 FT CHAIN 457 588 DECAPENTAPLEGIC PROTEIN. FT DISULFID 487 553 BY SIMILARITY. FT DISULFID 516 585 BY SIMILARITY. FT DISULFID 520 587 BY SIMILARITY. FT DISULFID 552 552 INTERCHAIN (BY SIMILARITY). FT CARBOHYD 120 120 POTENTIAL. FT CARBOHYD 342 342 POTENTIAL. FT CARBOHYD 377 377 POTENTIAL. FT CARBOHYD 529 529 POTENTIAL. SQ SEQUENCE 588 AA; 65850MW; 1768420 CN; MRAWLLLLAV LATFQTIVRV ASTEDISQRF IAAIAPVAAH IPLASASGSG SGRSGSRSVG ASTSTAGAKA FNRFSEPASF SDSDKSHRSK TNKKPSKSDA NRQFNEVHKP RTDQLENSKN KSKQLVNKPN HNKMAVKEQR SHHKKSHHHR SHQPKQASAS TESHQSSSIE SIFVEEPTLV LDREVASINV PANAKAIIAE QGPSTYSKEA LIKDKLKPDP STYLVEIKSL LSLFNMKRPP KIDRSKIIIP EPMKKLYAEI MGHELDSVNI PKPGLLTKSA NTVRSFTHKD SKIDDRFPHH HRFRLHFDVK SIPADEKLKA AELQLTRDAL SQQVVASRSS ANRTRYQBLV YDITRVGVRG QREPSYLLLD TKTBRLNSTD TVSLDVQPAV DRWLASPQRN YGLLVEVRTV RSLKPAPHHH VRLRRSADEA HERWQHKQPL LFTYTDDGRH DARSIRDVSG GEGGGKGGRN KRHARRPTRR KNHDDTCRRH SLYVDFSDVG WDDWIVAPLG YDAYYCHGKC PFPLADHRNS TNHAVVQTLV NNMNPGKBPK ACCBPTQLDS VAMLYLNDQS TVVLKNYQEM TVVGCGCR
What to align, nucleotide or amino acid sequences? If ORF then align at protein level • (i) Many mutations within DNA are synonymous, leading to overestimation of sequence divergence if compared at the DNA level. • (ii) Evolutionary relationships can be more finely expressed using a 20×20 amino acid exchange table than using nucleotide exchanges. • (iii) DNA sequences contain non-coding regions which should be avoided in homology searches. Still an issue when translating into (six) protein sequences through a codon table. • (iv) Searching at protein level: frameshifts can occur, leading to stretches of incorrect amino acids and possibly elongation of sequences due to missed stop codons. But frameshifts normally result in stretches of highly unlikely amino acids: can be used as a signal to trace.
A 2 R -2 6 N 0 0 2 D 0 -1 2 4 C -2 -4 -4 -5 12 Q 0 1 1 2 -5 4 E 0 -1 1 3 -5 2 4 G 1 -3 0 1 -3 -1 0 5 H -1 2 2 1 -3 3 1 -2 6 I -1 -2 -2 -2 -2 -2 -2 -3 -2 5 L -2 -3 -3 -4 -6 -2 -3 -4 -2 2 6 K -1 3 1 0 -5 1 0 -2 0 -2 -3 5 M -1 0 -2 -3 -5 -1 -2 -3 -2 2 4 0 6 F -4 -4 -4 -6 -4 -5 -5 -5 -2 1 2 -5 0 9 P 1 0 -1 -1 -3 0 -1 -1 0 -2 -3 -1 -2 -5 6 S 1 0 1 0 0 -1 0 1 -1 -1 -3 0 -2 -3 1 2 T 1 -1 0 0 -2 -1 0 0 -1 0 -2 0 -1 -3 0 1 3 W -6 2 -4 -7 -8 -5 -7 -7 -3 -5 -2 -3 -4 0 -6 -2 -5 17 Y -3 -4 -2 -4 0 -4 -4 -5 0 -1 -1 -4 -2 7 -5 -3 -3 0 10 V 0 -2 -2 -2 -2 -2 -2 -1 -2 4 2 -2 2 -1 -1 -1 0 -6 -2 4 B 0 -1 2 3 -4 1 2 0 1 -2 -3 1 -2 -5 -1 0 0 -5 -3 -2 2 Z 0 0 1 3 -5 3 3 -1 2 -2 -3 0 -2 -5 0 0 -1 -6 -4 -2 2 3 A R N D C Q E G H I L K M F P S T W Y V B Z PAM250 matrix WR exchange is too large (due to paucity of data)
PAM model The scores derived through the PAM model are an accurate description of the information content (or the relative entropy) of an alignment (Altschul, 1991). PAM-1 corresponds to about 1 million years of evolution PAM-120 has the largest information content of the PAM matrix series PAM-250 is the traditionally most popular matrix
PAM / MDM / Dayhoff -- summary • The late Margaret Dayhoff was a pioneer in protein databasing and comparison. She and her coworkers developed a model of protein evolution which resulted in the development of a set of widely used substitution matrices. These are frequently called Dayhoff, MDM (Mutation Data Matrix), or PAM (Percent Accepted Mutation) matrices: • Derived from global alignments of closely related sequences. • Matrices for greater evolutionary distances are extrapolated from those for lesser ones. • The number with the matrix (PAM40, PAM100) refers to the evolutionary distance; greater numbers are greater distances. • Several later groups have attempted to extend Dayhoff's methodology or re-apply her analysis using later databases with more examples. • Extensions: • Jones, Thornton and coworkers used the same methodology as Dayhoff but with modern databases (CABIOS 8:275) • Gonnett and coworkers (Science 256:1443 - 1992) used a slightly different (but theoretically equivalent) methodology • Henikoff & Henikoff (Proteins 17:49 - 1993) compared these two newer versions of the PAM matrices with Dayhoff's originals.
The Blocks Database The Blocks Database contains multiple alignments of conserved regions in protein families. Blocks are multiply aligned ungapped segments corresponding to the most highly conserved regions of proteins. The blocks for the BLOCKS database are made automatically by looking for the most highly conserved regions in groups of proteins represented in the PROSITE database . These blocks are then calibrated against the SWISS-PROT database to obtain a measure of the chance distribution of matches. It is these calibrated blocks that make up the BLOCKS database. The database can be searched by e-mail and World Wide Web (WWW) servers (http://blocks.fhcrc.org/help) to classify protein and nucleotide sequences.
The Blocks Database Gapless alignment blocks
The BLOSUM series • The BLOSUM series of matrices were created by Steve Henikoff and colleagues (PNAS 89:10915). • Derived from local, ungapped alignments of distantly related sequences • All matrices are directly calculated; no extrapolations are used • The number after the matrix (BLOSUM62) refers to the minimum percent identity of the blocks used to construct the matrix; greater numbers denote lesser evolutionary distances. • The BLOSUM series of matrices generally perform better than PAM matrices for local similarity searches (Proteins 17:49).
The BLOSUM series Blosum30, 35, 40, 45, 50, 55, 60, 62, 65, 70, 75, 80, 85, 90 Blosum62 is based only on blocks in the BLOCKS database with at least 62% identity No extrapolations are made in going to higher evolutionary distancesHigh blosum - closely related sequencesLow blosum - distant sequencesblosum62 is the most popular
Blosum Entropy PAM Entropy 30 0.1424 10 3.43 35 0.2111 50 2 40 0.2851 80 1.44 45 0.3795 100 1.18 50 0.4808 120 0.979 55 0.5637 180 0.591 60 0.6603 200 0.507 62 0.6979 250 0.354 65 0.7576 300 0.254 70 0.8391 350 0.186 75 0.9077 400 0.139 80 0.9868 450 0.105 85 1.0805 500 0.0803 90 1.1806 100 1.4516 Comparing exchange matrices To compare amino acid exchange matrices, the "Entropy" value can be used. This is a relative entropy value which describes the amount of information available per aligned residue pair. As two protein sequences diverge over time, information about the evolutionary process at work is lost (e.g. back mutations). Therefore, matrices with larger entropy values are more sensitive to less divergent sequences, while matrices with smaller entropy values are more sensitive to distantly related sequences.
GONNET MatrixA different method to measure differences among amino acids was developed by Gonnet, Cohen and Benner (1992) using exhaustive (i.e. all against all) pairwise alignments of the protein databases as they existed at that time. They used classical distance measures to estimate an alignment of the proteins. They then used this data to estimate a new distance matrix. This was used to refine the alignment, estimate a new distance matrix and so on iteratively. They noted that the distance matrices (all first normalized to 250 PAMs) differed depending on whether they were derived from distantly or closely homologous proteins. They suggest that for initial comparisons their resulting matrix should be used in preference to a PAM250 matrix, and that subsequent refinements should be done using a PAM matrix appropriate to the distance between proteins.
Specialized Matrices • Claverie (J.Mol.Biol 234:1140) has developed a set of substitution matrices designed explicitly for finding possible frameshifts in protein sequences. • These matrices are designed solely for use in protein-protein comparisons; they should not be used with programs which blindly translate DNA (e.g. 6-frame translation, as is done by the methods BLASTX or TBLASTN).
Rissler et al (1988), Overington et al (1992) Rather than starting from alignments generated by sequence comparison, Rissler et al (1988) and later Overington et al (1992) only considered proteins for which an experimentally determined three dimensional structure is available. They then aligned similar proteins on the basis of their structure rather than sequence and used the resulting sequence alignments as their database from which to gather substitution statistics. In principle, the Rissler or Overington matrices should give more reliable results than either PAM of BLOSUM. However, the comparatively small number of available protein structures (particularly in the Rissler et al study) limited the reliability of their statistics. Overington et al (1992) developed further matrices that consider the local environment of the amino acids.
Amino acid exchange matricessummary • Apart from the PAM and Blosum series, a great number of further matrices have been developed • Matrices have been made based on DNA, protein structure, information content, etc. • For local alignment, Blosum 62 is often superior; for distant (global) alignments, Blosum50, Gonnet, or (still) PAM250 work well • Remember that gap penalties are always a problem. Unlike the matrices themselves, there is no formal way to calculate their values -- you can follow recommended settings, but these are based on trial and error and not on a formal framework.