Download
1 / 46
460 likes | 629 Vues
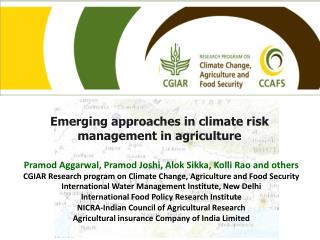
Pierpaolo Duce CNR-IBIMET, Sassari , ITALY Antonio Arca, Donatella Spano DESA, University of Sassari, ITALY Simona Canu, Andrea Motroni SAR - SARDEGNA, Sassari, ITALY Gabriele Antolini, Franco Zinoni ARPA-SM, Bologna, ITALY. WORKSHOP ON CLIMATIC ANALYSIS AND MAPPING FOR AGRICULTURE

E N D
Pierpaolo Duce CNR-IBIMET, Sassari, ITALY Antonio Arca, Donatella Spano DESA, University of Sassari, ITALY Simona Canu, Andrea Motroni SAR - SARDEGNA, Sassari, ITALY Gabriele Antolini, Franco Zinoni ARPA-SM, Bologna, ITALY WORKSHOP ON CLIMATIC ANALYSIS AND MAPPING FOR AGRICULTURE 14-17 June 2005, Bologna, Italy Climatic variability and climate risk in agriculture in the Mediterranean area
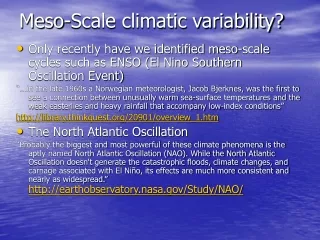
Climatic Variations – Background IPCC Working Group II, 2001
Climatic Variations – Background IPCC Working Group II, 2001
Climatic Variations – Background Temperature and Precipitation – Italy - 1867-1995 Yearly and seasonal trends (Brunetti et al., 2000) ± s b b T P (°C/100 y) (mm/100 y) North ± ± 0.4 0.1 - 47 17 Year South ± ± 0.7 0.1 - 104 12 ± ± 0.7 0.1 8 North 7 Winter ± ± 0.9 0.1 - 16 South 7 ± ± - 0.2 0.1 7 North 6 Summer ± ± 0.5 0.1 - 17 South 4
CLIMATIC VARIABILITY AND CLIMATE RISKIN AGRICULTURE IN THE MEDITERRANEAN AREA Objectives • to develop a methodology for assessing climatic risk based on bioclimatic indexes • to evaluate the potential effects of climatic variations on agricultural production
CLIMATIC VARIABILITY AND CLIMATE RISKIN AGRICULTURE IN THE MEDITERRANEAN AREA Objectives • to develop a methodology for assessing climatic risk based on bioclimatic indexes • to evaluate the potential effects of climatic variations on agricultural production
CLIMATIC VARIABILITY AND CLIMATE RISKIN AGRICULTURE IN THE MEDITERRANEAN AREA Objectives • to obtain maps of climatic risk for agriculturebased on past and future climatic variability
CLIMATIC VARIABILITY AND CLIMATE RISK Activities Data Collection soil, land cover, climate, climatic scenarios A2 and B2 Land Capability for Agriculture (LCA)classifications (based on pedology, climate and land cover) Assessment of current and future climatic risk for agricultural areas and crops
CLIMATIC VARIABILITY AND CLIMATE RISK GIS ArcGIS Data • Geology, pedology, morphology, etc. • Climate (1961-2000 Sardinia, 1951-2000 Emilia-Romagna)temperature and rainfall series - complete • Climate (1961-2000 Sardinia, 1951-2000 Emilia-Romagna) temperature and rainfall series - incomplete • Land Cover Map
Methods LCA Classifications • Modification of the Soil Map of Sardinia and Emilia-Romagna Pedological LCAClassification • Bioclimatic index calculation – Cluster Analysis (weather stations) Climatic LCAClassification • Climatic data mapping (10 km x 10 km grid) Bioclimatic index calculation over the same grid Climatic LCAClassification for each cell of the grid • Overlay Pedological LCA – Climatic LCA Pedo-climatic LCAClassification
Methods LCA Classifications • Modification of the Soil Map of Sardinia and Emilia-Romagna Pedological LCAClassification • Bioclimatic index calculation – Cluster Analysis (weather stations) Climatic LCAClassification • Climatic data mapping (10 km x 10 km grid) Bioclimatic index calculation over the same grid Climatic LCAClassification for each cell of the grid • Overlay Pedological LCA – Climatic LCA Pedo-climatic LCAClassification
Methods LCA Classifications • Modification of the Soil Map of Sardinia and Emilia-Romagna Pedological LCAClassification • Bioclimatic index calculation – Cluster Analysis (weather stations) Climatic LCAClassification • Climatic data mapping (10 km x 10 km grid) Bioclimatic index calculation over the same grid Climatic LCAClassification for each cell of the grid • Overlay Pedological LCA – Climatic LCA Pedo-climatic LCAClassification
Methods LCA Classifications • Modification of the Soil Map of Sardinia and Emilia-Romagna Pedological LCAClassification • Bioclimatic index calculation – Cluster Analysis (weather stations) Climatic LCAClassification • Climatic data mapping (10 km x 10 km grid) Bioclimatic index calculation over the same grid Climatic LCAClassification for each cell of the grid • Overlay Pedological LCA – Climatic LCA Pedo-climatic LCAClassification
CLIMATIC VARIABILITY AND CLIMATE RISK Pedo-climaticLCAclassificationmap Climatic Risk Assessment Pedological LCA classification map Climatic LCA classificationmap Analysis of spatial and temporal variability Bioclimatic Indexes Climatic Risk Index Classification
PEDOLOGICAL LCA MAP SARDINIA 8 classes Class 1: no or very minor limitations to agriculture . . . . . . . Class 8: no agriculture use Class 1-4: Land suitable for agriculture 23.7% Class 5-8: Land not suitable for agriculture 75.4%
365 ( ) å - T T o m = i 1 365 ( ) å ETo P - MAX i i = i 1 CLIMATIC LCA MAP Bioclimatic Index Calculations • HEAT UNIT CUMULATIVE DEGREE-DAYS S°D lower quartile • WATER LIMITATIONS MAXIMUM POTENTIAL SOIL MOISTURE DEFICIT MaxPSMDmedian
365 ( ) å - T T o m = i 1 365 ( ) å ETo P - MAX i i = i 1 CLIMATIC LCA MAP Bioclimatic Index Calculations • HEAT UNIT CUMULATIVE DEGREE-DAYS S°D lower quartile • WATER LIMITATIONS MAXIMUM POTENTIAL SOIL MOISTURE DEFICIT MaxPSMDmedian
CLIMATIC LCA MAP Bioclimatic Index Analysis
MaxPSMD ( mm ) -1000 -900 -800 -700 -600 -500 -400 -300 -200 -100 0 7500 7.1 6.1 7000 5.1 4.1 3.1 2.1 calagonone 1 6500 capo carbonara 2.2 bosa carloforte corongiu 3.2 capo bellavista piscinamanna s. giusta muravera palmas suergiu 6000 iglesias 4.2 orosei villacidro f.c. uta escalaplano capo frasca olbia mogoro (diga) elmas budoni (c.ra) decimomannu santa lucia asinara alghero rifornitore 5.2 armungia s. giovanni coghinas ottava sassari (serra secca) sanluri o.n.c. 5500 tirso jerzu ozieri D oschiri lanusei villavovatulo castiadas cuglieri 6.2 macomer campuomu S° nuoro meanasardo bidighinzu mandas f. c. 5000 villanova monteleone nurri f. c. tempio 7.2 is cannoneris 4500 desulo ala' dei sardi sos canales (diga) col. penale sarcidano santa sofia 4000 genna-silana vallicciola 3500 3000 CLIMATIC LCA MAP Climatic LCA Classification
Max Potential Soil Moisture Deficit 1971-2000 Max Potential Soil Moisture Deficit 1961-1990
Climatic Land Capability 1961-1990 Climatic Land Capability 1971-2000 Prime Classes Prime Classes Non Prime Classes Non Prime Classes
Pedo-climatic LCA class Pedological LCA classes Climatic LCA classes most suitable 1 to 4 1, 21, 22, 31 moderately suitable 4-6, 4-8, 6 1, 21, 22, 31 less suitable 6-7, 6-8 Prime + 32, 41, 42 not suitable 8 - PEDO-CLIMATIC LCA MAP Pedo-climatic LCA Classification
Pedo-Climatic Land Capability 1961-2000 PEDO-CLIMATIC LCA MAP (1961-2000) most suitable (23.7%) Classes most suitable moderately suitable (27.7%) moderately suitable least suitable less suitable (17.4%) not suitable not suitable (31.2%)
PEDO-CLIMATIC LCA MAP (1971-2000) most suitable mod. suitable less suitable not suitable
CLIMATIC RISK MAP Climate Variability Analysis -640 -540 -440 -340 -160 D6 D5 D4 Cell #1 D3 D2 D1
Cell # MaxPSMD median D1 D2 D3 D4 D5 D6 1 - 565 0 3 6 3 15 3 2 - 646 0 0 2 8 5 15 3 - 615 0 2 3 6 5 14 4 - 625 0 2 2 7 5 14 5 - 623 0 2 2 6 6 14 6 - 600 0 2 5 4 10 9 7 - 639 0 0 2 8 5 15 8 - 581 0 2 6 3 12 7 9 - 498 0 7 4 10 7 2 10 - 547 0 3 7 4 11 5 11 - 630 0 0 3 8 5 14 12 - 400 3 8 8 8 3 0 13 - 409 2 9 7 9 3 0 14 - 562 0 3 6 4 11 6 15 - 619 0 2 2 7 7 12 CLIMATIC RISK MAP Climate Variability Analysis
Class D1 D2 D3 D4 D5 D6 coefficient 0 0.05 0.5 0.75 0.9 1 Cell # D1 D2 D3 D4 D5 D6 1 0.00 0.10 0.20 0.10 0.50 0.10 2 0.00 0.00 0.07 0.27 0.17 0.50 3 0.00 0.07 0.10 0.20 0.17 0.47 4 0.00 0.07 0.07 0.23 0.17 0.47 5 0.00 0.07 0.07 0.20 0.20 0.47 CLIMATIC RISK MAP Climate Variability Analysisand Climate Risk Assessment f Risk Index =
Null 0 - 0.25 Low 0.25 - 0.50 Moderate 0.50 - 0.75 High 0.75 - 1.00 CLIMATIC RISK MAP Climate Risk Assessment Risk Class Risk Index
Climatic Risk1961-1990 Climatic Risk1971-2000 null null low low moderate moderate high high
A2 B2 FUTURE CLIMATE SCENARIOS • Data obtained from CNR – IBIMET, FlorenceSub-project 1: High resolution future climate scenarios • Climate Model developed by Hadley Centre (Met. Office, UK) HADCM3 Model (AOGCM) • Climate scenarios A2 and B2 • Period 2005-2099
Growing Degree Days 1971-2000 Growing Degree Days2070-2099 (Scenario B2) GDD GDD
Max Potential Soil Moisture Deficit 1971-2000 Max Potential Soil Moisture Deficit2070-2099 (Scenario A2)
Climatic Land Capability 2070-2099 (Scenario A2) Climatic Land Capability 1971-2000 Prime Classes Prime Classes Non Prime Classes Non Prime Classes
Pedo-Climatic Land Capability 1961-2000 PEDO-CLIMATIC LCA MAP (1961-2000) most suitable (23.7%) Classes most suitable moderately suitable (27.7%) moderately suitable least suitable less suitable (17.4%) not suitable not suitable (31.2%)
Pedo-Climatic Land Capability 2070-2099 (Scenario A2) PEDO-CLIMATIC LCA MAP (2070-2099 – A2) most suitable (10.5%) Classes most suitable moderately suitable (19.3%) moderately suitable least suitable less suitable (38.4%) not suitable not suitable (31.8%)
Pedo-Climatic Land Capability 2070-2099 (Scenario B2) PEDO-CLIMATIC LCA MAP (2070-2099 – B2) most suitable (14.0%) Classes most suitable moderately suitable (19.7%) moderately suitable least suitable less suitable (35.4%) not suitable not suitable (30.9%)
CLIMATIC VARIABILITY AND CLIMATE RISK Conclusions • To determine climatic risk for agriculture, climatic variability should be included in the LCA methodology • The methodology can be easily applied to actual and future climate
CLIMATIC VARIABILITY AND CLIMATE RISK Conclusions • To determine climatic risk for agriculture, climatic variability should be included in the LCA methodology • The methodology can be easily applied to actual and future climate
CLIMATIC VARIABILITY AND CLIMATE RISK Conclusions • By adjusting bioclimatic indexes, the methodology can be applied to different climatic regions • Limitations of the results mainly depend on spatial resolution of input data and approximations derived from empirical analysis
CLIMATIC VARIABILITY AND CLIMATE RISK Conclusions • By adjusting bioclimatic indexes, the methodology can be applied to different climatic regions • Limitations of the results mainly depend on spatial resolution of input data and approximations derived from empirical analysis
Climatic Risk2070-2099 (Scenario B2) Climatic Risk1971-2000 null null low low moderate moderate high high