SOFTWARE PROJECT PLANNING
SOFTWARE PROJECT PLANNING. Overview. Fundamentals of project planning and estimating Metrics for software productivity assessment Different techniques that can be used for estimation Algorithmic cost estimation method -COCOMO Project scheduling and tracking


SOFTWARE PROJECT PLANNING
E N D
Presentation Transcript
Overview • Fundamentals of project planning and estimating • Metrics for software productivity assessment • Different techniques that can be used for estimation • Algorithmic cost estimation method -COCOMO • Project scheduling and tracking • Framework for Software Project Management Plan (SPMP)
Fundamental estimation questions • How much effort is required to complete an activity? • How much calendar time is needed to complete an activity? • What is the total cost of an activity? • Project estimation and scheduling and interleaved management activities
Planning and estimating • Ideally, we would like to plan the entire software project at the very beginning of the process • The earliest possible detailed planning is after the specification phase • Accuracy of estimation increases as the process proceeds • Accurate duration estimation is critical • Accurate cost estimation is critical • Internal cost • External cost • There are too many variables for accurate estimate of cost or duration
Software pricing factors There is not a simple relationship between the development cost and the price charged to the customer
Overview • Fundamentals of project planning and estimating • Metrics for software productivity assessment • Different techniques that can be used for estimation • Algorithmic cost estimation method -COCOMO • Project scheduling and tracking • Framework for Software Project Management Plan (SPMP)
Programmer productivity • A measure of the rate at which individual engineers involved in software development produce software and associated documentation • Not quality-oriented although quality assurance is a factor in productivity assessment • Essentially, we want to measure useful functionality produced per time unit
Productivity measures • Size related measures based on some output from the software process. This may be lines of delivered source code, object code instructions, etc. • Function-related measures based on an estimate of the functionality of the delivered software. Function-points are the best known of this type of measure
Lines of code • Lines of code (LOC), or • Thousand delivered source instructions (KDSI) • Source code is only a small part of total software effort • Different languages different lengths of code • LOC not defined for nonprocedural languages (like LISP) • It is not clear how to count lines of code • Executable lines of code? • Data definitions? • Comments? • Changed/deleted lines? • Not everything written is delivered to the client
Function points (FP) • Based on a combination of program characteristics • external inputs and outputs • user interactions • external interfaces • files used by the system • A weight is associated with each of these • The function point count is computed by multiplying each raw count by the weight and summing all values
Function points (contd.) • For example FP = 4 × Inp + 5 × Out + 4 × Inq + 10 × Maf + 7 × Inf • Inp - number of inputs • Out – number of outputs • Inq - inquiries • Maf - master files • Inf - interfaces • FPsmay be subjective
Object points • Object points are an alternative function-related measure to function points when 4Gls or similar languages are used for development • Object points are NOT the same as object classes • The number of object points in a program is a weighted estimate of • The number of separate screens that are displayed • The number of reports that are produced by the system • The number of 3GL modules that must be developed to supplement the 4GL code
Object point estimation • Object points are easier to estimate from a specification than function points as they are simply concerned with screens, reports and 3GL modules • They can therefore be estimated at an early point in the development process. At this stage, it is very difficult to estimate the number of lines of code in a system • Object points are used in the COCOMO II estimation model
Productivity estimates • Real-time embedded systems, 40-160 LOC/month • Systems programs, 150-400 LOC/month • Commercial applications, 200-800 LOC/month • In object points, productivity has been measured between 4 and 50 object points/month depending on tool support and developer capability
Quality and productivity • All metrics based on volume/unit time are flawed because they do not take quality into account • Productivity may generally be increased at the cost of quality • It is not clear how productivity/quality metrics are related
Overview • Fundamentals of project planning and estimating • Metrics for software productivity assessment • Different techniques that can be used for estimation • Algorithmic cost estimation method -COCOMO • Project scheduling and tracking • Framework for Software Project Management Plan (SPMP)
Estimation techniques • Expert judgment • Estimation by analogy • Pricing to win • Algorithmic cost modeling
Expert judgment • One or more experts in both software development and the application domain use their experience to predict software costs • Process iterates until some consensus is reached • Advantages • Relatively cheap estimation method • Can be accurate if experts have direct experience of similar systems • Disadvantages • Very inaccurate if there are no experts!
Estimation by analogy • The cost of a project is computed by comparing the project to a similar project in the same application domain • Advantages • Accurate if project data available • Disadvantages • Impossible if no comparable project has been tackled • Needs systematically maintained cost database
Pricing to win • The project costs whatever the customer has to spend on it • This approach may seem unethical and un-businesslike. However, when detailed information is lacking it may be the only appropriate strategy • Advantages • You get the contract • Disadvantages • The probability that the customer gets the system he or she wants is small • Costs do not accurately reflect the work required
Top-down and bottom-up estimation • Any of these approaches may be used top-down or bottom-up • Top-down • Usable without knowledge of the system architecture and the components that might be part of the system • Takes into account costs such as integration, configuration management and documentation • Can underestimate the cost of solving difficult low-level technical problems • Bottom-up • Usable when the architecture of the system is known and components identified • Accurate method if the system has been designed in detail • May underestimate costs of system level activities such as integration and documentation
Algorithmic cost modeling • Cost is estimated as a mathematical function of product, project and process attributes whose values are estimated by project managers Effort= A × SizeB × M • A is an organization-dependent constant • B reflects the disproportionate effort for large projects • M is a multiplier reflecting product, process and people attributes • Most commonly used product attribute for cost estimation is code size • Most models are basically similar but with different values for A, B and M
Estimation accuracy • The size of a software system can only be known accurately when it is finished • Several factors influence the final size • Use of COTS and reused components • Programming language • Distribution of system • As the development process progresses the size estimate becomes more accurate
Overview • Fundamentals of project planning and estimating • Metrics for software productivity assessment • Different techniques that can be used for estimation • Algorithmic cost estimation method -COCOMO • Project scheduling and tracking • Framework for Software Project Management Plan (SPMP)
The COCOMO model • Constructive COst MOdel-an empirical model based on project experience http://sunset.usc.edu/csse/research/COCOMOII/cocomo_main.html • Well-documented, ‘independent’ model which is not tied to a specific software vendor • Long history from initial version published in 1981 (COCOMO-81) through various instantiations to COCOMO II • COCOMO II takes into account modern SE technologies, various life cycle models, rapid prototyping, reuse, and COTS software
COCOMO II • COCOMO II has three levels that allow increasingly detailed estimates to be prepared as development progresses • Early prototyping level • Estimates based on object points and a simple formula is used for effort estimation • Early design level • Estimates based on function points that are then translated to LOC • Post-architecture level • Estimates based on lines of source code
Early prototyping level • Supports prototyping projects and projects where there is extensive reuse • Based on standard estimates of developer productivity in object points/month • Takes CASE tool use into account • Formula is PM= ( NOP×(1 -%reuse/100 ) ) / PROD • PM is the effort in person-months • NOP is the number of object points • PROD is the productivity
Early design level • Estimates can be made after the requirements have been agreed • Based on standard formula for algorithmic models PM= A × SizeB × M + PMm where • A = 2.5 in initial calibration • Size in KLOC • B varies from 1.1 to 1.24 depending on novelty of the project, development flexibility, risk management approaches and the process maturity • M is multiplier • PMm reflects the amount of automatically generated code
Early design level -Multipliers • Multipliers reflect the capability of the developers, the non-functional requirements, the familiarity with the development platform, etc. M= PERS ×RCPX ×RUSE ×PDIF ×PREX ×FCIL ×SCED where • PERS - personnel capability • RCPX - product reliability and complexity • RUSE - the reuse required • PDIF - platform difficulty • PREX - personnel experience • FCIL - the team support facilities • SCED - required schedule
Post-architecture level -Size • Uses same formula as early design estimates • Estimate of size is adjusted to take into account • Requirements volatility -rework required to support change • Extent of possible reuse -reuse is non-linear and has associated costs so this is not a simple reduction in LOC ESLOC = ASLOC ×(AA + SU +0.4DM + 0.3CM +0.3IM) / 100 • ESLOC is equivalent number of lines of new code • ASLOC is the number of lines of reusable code which must be modified • AA is a factor which reflects the initial assessment costs of deciding if software may be reused • SU is a factor based on the cost of software understanding • DM is the percentage of design modified • CM is the percentage of the code that is modified • IM is the percentage of the original integration effort required for integrating the reused software
Post-architecture level -Exponent term • Sum of 5 scale factors /100 + 1.01
Post-architecture level -Exponent term • Example • Precedenteness: new project; Low 4 • Development flexibility: no client involvement; Very high 1 • Architecture/risk resolution: no risk analysis; Very low 5 • Team cohesion: new team; Nominal 3 • Process maturity: some control; nominal 3 • Scale factor is therefore 1.17
Project duration • Calendar time can be estimated using a COCOMO II formula TDEV = 3 ×(PM)(0.33+0.2*(B-1.01)) • PM is the effort computation • B is the exponent computed as discussed above (B is 1 for the early prototyping model • The time required is function of the total effort; it is independent of the number of people working on the project • Adding more people to a project that is behind schedule is unlikely to help
Overview • Fundamentals of project planning and estimating • Metrics for software productivity assessment • Different techniques that can be used for estimation • Algorithmic cost estimation method -COCOMO • Project scheduling and tracking • Framework for Software Project Management Plan (SPMP)
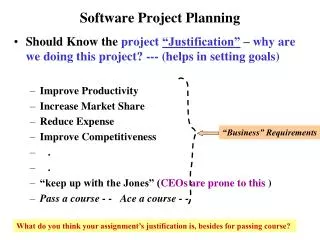
Why are projects late? • An unrealistic deadline established by someone outside the software development group • Changing customer requirements that are not reflected in schedule changes • An honest underestimate of the amount of effort and/or the number of resources that will be required to do the job • Predictable and/or unpredictable risks that were not considered when the project commenced • Technical difficulties that could not have been foreseen in advance • Human difficulties that could not have been foreseen in advance • Miscommunication among project staff that results in delays • A failure by project management to recognize that the project is falling behind schedule and a lack of action to correct the problem
Software project scheduling • Compartmentalization • define a number of manageable distinct tasks • Interdependency • Determine interdependency of each task • Some tasks must occur in sequence, other can occur in parallel • Time allocation • Each task must be allocated a number of work units, a start date& a completion date • Define responsibilities • Team members should be assigned to every scheduled task • Defined outcomes • Every task should have a defined outcome (work product) • Defined milestones • Every task or group of tasks should be associated with a project milestone; work products are reviewed for quality and approved
Relationship between staff & effort • Man –month as a unit for measuring the size of a job is dangerous and deceptive myth • Man & months are interchangeable only when a task can be partitioned among many workers with no communication among them; some tasks can not be partitioned because of sequential constraints • The number of people working on a project varies depending on the phase of the project • Adding people late in a project often causes schedules to slip even further
Effort allocation: 40-20-40 rule • “Front end” activities • customer communication • analysis • design • review and modification 40%- 50% • Construction activities • coding or code generation 15%- 20% • Testing and installation • unit, integration • black-box, white-box • regression 30%- 40%
Defining a task network • Task network (activity network) is a graphic representation of the task flow for a project
Scheduling • Scheduling of software project does not differ greatly from scheduling of any multitask engineering effort • Driven by • Estimates of effort • A decomposition of the product function • The selection of the appropriate process model & task set • Decomposition of tasks
Scheduling • Tools allow software planner to • Determine the critical path (e.g. the chain of tasks) that determines the duration of the project • Establish “most likely” time estimates for individual tasks by applying statistical models • Calculate “boundary times” that define a time “window” for a particular task • The earliest time that a task can begin when all preceding tasks are completed in the shortest possible time • The latest time for task initiation before the minimum project time completion time is delayed • The earliest finish time • The latest finish time • The total float –the amount of surplus time allowed in scheduling tasks so that the critical path is maintained on schedule
Tracking the schedule • Conduct periodic project status meetings in which each team member reports progress and problems • Determine whether formal project milestones have been accomplished • Compare actual start date to planned start date for each project task • Meet informally with practitioners to obtain their subjective assessment of progress to date and problems on the horizon • Assess progress quantitatively (e.g., earned value analysis)
Overview • Fundamentals of project planning and estimating • Metrics for software productivity assessment • Different techniques that can be used for estimation • Algorithmic cost estimation method -COCOMO • Project scheduling and tracking • Framework for Software Project Management Plan (SPMP)
1. Introduction 1.1. Project overview 1.2. Project deliverables 1.3. Evolution of the SPMP 1.4. Reference materials 1.5. Definitions and acronyms 2. Project organization 2.1. Process model 2.2. Organizational structure 2.3. Organizational boundaries and Interfaces 2.4. Project responsibilities 3. Managerial process 3.1.Management objectives and priorities 3.2. Assumptions, dependencies, and constraints 3.3. Risk management 3.4. Monitoring and controlling mechanisms 3.5. Staffing plan 4. Technical process 4.1. Methods, tools, and techniques 4.2. Software documentation 4.3. Project support function 5. Work packages, schedule, and budget 5.1. Work packages 5.2. Dependencies 5.3. Resources requirements 5.4. Budget and resource allocation 5.5. Schedule Additional components Framework for SPMP -IEEE Standard 1058.1
CASE tools for the planning • Word processor, spreadsheet • Automated intermediate COCOMO/COCOMO II • Management tools assist with planning and monitoring • Mac Project • Microsoft Project