Download
1 / 57
580 likes | 878 Vues
Improving Healthcare with Healthcare Intelligence 2012 OCHIN Learning Forum Saturday, 15 November 2012 Dick Gibson MD PhD Chief Healthcare Intelligence Officer Providence Health & Services – Renton WA. Agenda. External and Internal Environment. Three Data Platforms: EMR Reporting.

E N D
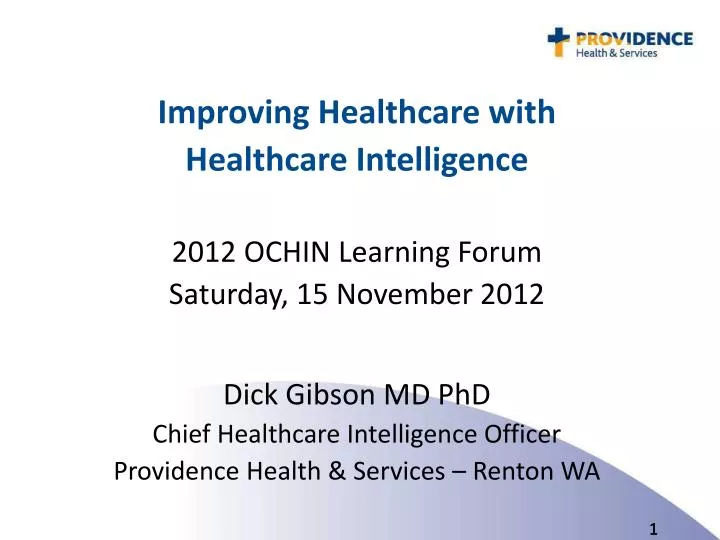
Improving Healthcare with Healthcare Intelligence 2012 OCHIN Learning Forum Saturday, 15 November 2012 Dick Gibson MD PhD Chief Healthcare Intelligence Officer Providence Health & Services – Renton WA
Agenda • External and Internal Environment. • Three Data Platforms: • EMR Reporting. • Caradigm (formerly Microsoft) Amalga. • Enterprise Data Warehouse. • Continuously Learning Organization. • Big Data. • Conclusions.
What we believe about the future • More care done for lower Per Member Per Month. • Mental Health Care & Post Acute Care will grow significantly. • Less reliance on physicians & more on alternative providers. • More care delivered at home, at work, & on mobile devices. • More self-care with Internet information sources. • More scrutiny of our care by regulatory & consumer bodies. • More telehealth, teleradiology, telepharmacy, etc. • Genomic and proteomic data will revolutionize healthcare but not for a few years. • More reimbursement by Health Savings Accounts (more retail a la carte buying) and by global premium.
If it is not indicated, we don’t do it. If it is indicated, we do it reliably. If we do it, we do it flawlessly. We study our results and we continuously improve.
Including Swedish Health Services • 32 hospitals • 7,000 beds • 65,000 employees • 2,500 employed physicians • 285 clinics • 400,000 member health plan • $11Billion Net Revenue
Two kinds of information systems • Transaction Systems: Epic Hyperspace for healthcare. • Captures all characterizations of the patient’s status. • Both Pre-intervention & Post-intervention. • Captures all our interventions: diagnostic & therapeutic. • Point-of-care Clinical Decision Support guides providers. • Reporting Systems: Retrospectively examine outcomes. • Epic Clarity Reporting Database. • Caradigm Amalga. • Enterprise Data Warehouse (EDW).
Health Care Intelligence with three overlapping platforms Epic Clarity Reporting Database Enterprise Data Warehouse Caradigm Amalga Routine scheduled operations reports. Everything within Epic. Can be integrated with transaction system. Updated nightly. Meaningful Use reports. Used by dept manager. Current care of active inpts. Data updated near realtime. Alert leads to immediate intervention. Data from multiple clinical systems. Used by clinician, RN manager, or MD manager. Review care over time. All patients, all settings. Data updated nightly. Retrospective analysis guides decision–making. All clinical & financial data. Used by manager or analyst.
Epic Hyperspace Transaction System Single Epic Clarity Reporting Database (Enterprise Master File Infrastructure) Three Identical instances
Increased use of benchmarking means more data need to be collected
And a lot of the data must come from doctors at the point of care Thanks to Jeff Westcott MD at Swedish
For Epic Clarity Reporting: SAP Business Objects Crystal Reports • Operational reports built by IT, read by manager. • Precise, pixel perfect formatting. • High volume publishing. • Predictable questions. Web Intelligence • Query and analysis, sort, filter, drill down. • Business user or analyst interacts with the data. • Basic formatting only. • Unpredictable questions. Gradual trend from reports to analytics
Crystal Reports Drop Down Lists To Select Report Parameters
Crystal Reports Printout
Web Intelligence Pull the Data Fields here that you want to see on the screen. Pull the Data Fields here to determine what records to include in the output.
Caradigm Amalga is a new entry in data management GET STORE SHOW Data Acquisition & Distribution Engine (DADE) Data Store AmalgaClient DataElements Tables & SQL ViewsOptimized by Use SECURITY Raw data feeds Message Receiver Message Filer Message Queue Parsers Lifetime Raw Message Archive
Amalga collects data from multiple disparate transaction systems into one alerting engine • 117 servers. • 87 Terabytes of provisioned storage. • 121 near realtime interfaces. • Outbound alerts connected to paging systems. • Data presented in simple Excel-like row & column format.
From any row, one can jump to complete patient-level details
Location history – Useful to infection prevention practitioners
Sepsis Scoring • Scoring based on: • Vital signs. • 20 Lab analytes.
Input form for Global Trigger Tool
Providence’s Use of Amalga • Currently Active • Modified Early Warning System (MEWS). • Sepsis Scoring. • Catheter Associated Urinary Tract Infection. • Central Line Associated Blood Stream Infection. • In Process • Readmission Manager • C. difficile tracking. • Antimicrobial Stewardship. • Critical Care Acute Physiology Score.
Prediction Model for Readmission Manager(1 of 2) Factors positively correlated with 30-day readmission: • Stayed less than one day in the hospital. • Hour of visit = midnight. • Admission is unscheduled. • Number of visits in last six months: 6-20. • Diagnoses included: disorders of fluid, electrolytes, acid-base, acute renal failure.
Prediction Model for Readmission Manager(2 of 2) Factors negatively correlated with 30-day readmission: • Only one chronic condition. • Stayed 3-12 days in the hospital. • No chronic conditions. • No prior admissions. • Average gap in visits in the past year: 61-365 days. • Marital status = single.
Enterprise Data Warehouse (EDW) • Retrospective and analytical. • Updated nightly. • Useful for reports and ad hoc analyses that cross multiple clinical, financial, and administrative systems. • Users may find it easier to use than reporting against the transaction system. • Presents users with a single naming convention and allows use of multiple tools.
Source Systems Costing Mat Mgt Pt Satis MD Cred Epic Enterprise Data Warehouse Nightly Copy Staging Layer Bring over data from sources (transaction systems), table for table, without changing the data. Staging layer adopts the data model of the source system. Able to trace data back to the original source system entry. Costing Mat Mgt MD Cred Pt Satis Epic 32
Supply Chain Source Mart Client Satis Source Mart Epic Source Mart Cost Source Mart Provider Source Mart Source Marts Enterprise Data Warehouse Staging Layer Source Marts allow users to report and query directly from copy of the source system. Best for when all needed data come from one source system. Relieves transaction system from the CPU slowdown of reporting. New data are available each day for operational needs. Costing Mat Mgt MD Cred Pt Satis Epic 33
Enterprise Data Warehouse Staging Layer Need to conform dimensions that need to be linked in multiple source systems -- for example: • Patient ID in one system is Variable Integer. • Patient ID in second system is Variable 12 Characters. Costing Mat Mgt MD Cred Pt Satis Epic Data Bus Patient ID Provider ID Encounter ID Stock Keeping Unit (SKU) Simplified data bus eliminates detailed, time-consuming data model. Allows flexibility in bringing on new system with its own different data model. 34
Enterprise Data Warehouse Staging Layer Subject Marts can beconfigured quickly to meet specific analytical needs. Data can be copied if needed for performance reasons. Single source of truth for the organization. Costing Mat Mgt MD Cred Pt Satis Epic Data Bus Patient ID Provider ID Encounter ID Stock Keeping Unit (SKU) Total Hip Subject Mart Provider Comp Subj Mart Nursing Productivity Subject Mart Vag Delivery Subject Mart Subject Marts
Supply Chain Source Mart Client Satis Source Mart Epic Source Mart Cost Source Mart Provider Source Mart Source Marts Enterprise Data Warehouse Staging Layer Costing Mat Mgt MD Cred Pt Satis Epic Data Bus Patient ID Provider ID Encounter ID Stock Keeping Unit (SKU) Total Hip Subject Mart Provider Comp Subj Mart Nursing Productivity Subject Mart Vag Delivery Subject Mart Subject Marts
Supply Chain Team Medical Staff Office Epic Team Finance Team Quality Dept Data Quality Feedback to operational teams is crucial for improving overall value of the data and hence organizational success. Data Stewards are appointed from each major source area. Operations, not Healthcare Intelligence, determines the tolerance for • Null fields. • Duplicates. • Discharge Dates before Admission Dates. Costing Mat Mgt MD Cred Pt Satis Epic 37
Enterprise Data Warehouse Master Data Management for major assets of the health system: • Patient Identification. • Provider Identification. • Facility and Department Identification. Data Bus Patient ID Provider ID Encounter ID Stock Keeping Unit (SKU) Data Stewards from each major source system are responsible for that Master Data Table for entire company. Master Data become the single source of truth.
Organization-wide Reference Data • May be data and tables internal to the organization: • Surgical packs. • Drug formularies. • Job classifications. • May be data and tables external and industry-wide: • Diagnosis codes (ICD-10). • Procedure codes (ICD-10 and CPT-4). • Medication names and ingredients. • Standard addresses, zip codes, and census tracts.
Standard Naming Convention • Using CamelCase naming of tables and fields. • Ending with Data Type indicator. PatientFirstNameTXT. (indicating Text) OperationStartTimeDTS. (indicating DateTime Stamp) • Intuitive to any user who understanding clinical or business operations. • They can pull data together on-the-fly to answer questions. • Acts as a Semantic Layer in front of all the multiple source systems.
Before After Benefits of the Naming Convention 90% time extracting data 10% time interpreting data 10% time extracting data 90% time interpreting data
Metadata • “Data about data.” • Descriptions of the tables and the columns within the tables. • Shows the Original Source Name and the Standardized Name for the table and the columns. • Conditions under which the data were collected. • When to use one column versus another. • A list of acceptable values or a sample thereof.
Registries • Can be considered another kind of data mart: a collection of data about patients of special interest. • The EDW will likely have most of the transaction databases needed to fill the registry. • There is usually a need to collect human-abstracted data and type it in to the database. • Need a way to provide customizable data entry applications without requiring Information Services staff. • How to securely collect data from the patient via the Internet?
Adequate Tools for each User Role • Highly formatted, scheduled, widely distributed Reports: • Microsoft Report Builder. • SAP Business Objects Crystal Reports. • Ad hoc reporting (querying): • Microsoft PowerPivot (extension to Excel). • SAP Business Objects Web Intelligence (WebI). • Data Visualization • Microsoft Power View. • Tableau. • Dashboards • Microsoft PerformancePoint. • SAP Business Objects Xcelsius. • Data Mining and Statistical tools: SPSS, SAS, R.
What can Healthcare Intelligence do? • Analyze emergency department patient throughput. • Provide insight to revenue cycle performance in each work queue. • Assess physician clinical and productivity performance. • Calculate cost of an individual encounter or average cost of a service line in preparation for bundled or global payment. • Predict nurse staffing need for a shift in two weeks. • Highlight sources and cost of physician variation in normal vaginal delivery and newborn care. • Link physician office waiting time with client satisfaction.
Three stages of healthcare intelligence Prescriptive-we can suggest best diagnostic & treatment approach for patients with multiple chronic conditions. Predictive-we know who is likely to be severely ill next year. Descriptive-we know what we did and what works.
Nov 2011 An example of prescriptive analytics
What did their own patients tell them? • Overall 98 patients with lupus, 10 of them developed thrombosis (blood clots). • 15x: Relative risk of thrombosis with lupus and persistent proteinuria (protein in urine) vs lupus without proteinuria. • 12x: Relative risk of thrombosis with lupus and pancreatitis (inflammation of pancreas) versus lupus without pancreatitis.
Importance of this NEJM report • First report of using EMR patient data search to aid immediate care of a patient. • More EMRs lead to more data. • Idea can scale with large combined data sets. • Potentially better than anecdotal or expert opinion. • Challenge will be system speed and relevance of findings.