
Introduction to Technical Analysis: Key Concepts & Strategies
Learn the fundamentals of technical analysis, including moving averages, support and resistance, Fibonacci retracements, and more. Discover how this approach can enhance your trading decisions across various markets.

Introduction to Technical Analysis: Key Concepts & Strategies
E N D
Presentation Transcript
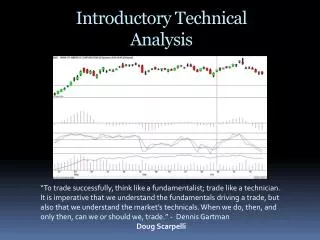
Introductory Technical Analysis “To trade successfully, think like a fundamentalist; trade like a technician. It is imperative that we understand the fundamentals driving a trade, but also that we understand the market’s technicals. When we do, then, and only then, can we or should we, trade.” - Dennis Gartman Doug Scarpelli
What is technical analysis? • The study of market/stock action that utilizes charts displaying price patterns and volume. These charts and the indicators applied offer predictive price movements and trends. • It attempts to explain price action based on market psychology. • Can be applied to all time frames from 5 minute charts to monthly charts and beyond. • Benefits of technical analysis: • More efficient/ lucrative for entries and exits • When paired with solid fundamental analysis, can help identify better opportunities • Technical's may change before the fundamentals, and vice versa • Get on board with the big players • Useful for equities, commodities, currencies, etc. • Help forecast price action for equity options
Moving Averages • Investopedia says: An Indicator used in technical analysis showing the average value of a security's price over a set period. • Measure momentum • Define support and resistance levels • MA crossovers • Important MA to long-term trends: • 50, 100, 200 • Prices tend to gravitate towards their MA’s (typically) • Simple moving average SMA • Exponential moving average EMA • One caution! • A 20 SMA is not the same on a 60 minute chart as a daily chart, or and MA or any time frame.
Support & Resistance • Investopedia explains support as: The price which, historically, a stock has had difficulty falling below. It is thought of as the level which a lot of buyers tend to enter the stock. • Resistance: The stock or market stops rising because sellers start to outnumber buyers. • Applying support & resistance • Moving averages • Trend lines • Channels • Can be used with almost any indicator • Directional support & resistance • Advancing • Declining • Horizontal
Fibonacci Retracements • Named after Leonardo Fibonacci , a thirteenth-century mathematician • The “Fibonacci numbers” a sequence of numbers where each successive number is the sum of the previous two. • 1,1,2,3,5,8,13,21,34,55,89,144, etc. • Each number is approximately 1.618 the previous number • Important ratios are: 0%, 23.6%, 38.2%, 50%, 61.8%, and 100% • The most popular studies are retracements, fans, arcs, and time zones • Retracements can be vary useful for • Entries, exits • Targets • Stops
Resources • Best Interactive Resources • www.freestockcharts.com • www.stockcharts.com (sharpcharts) • www.finviz.com • Bloomberg Terminal (Business Library) • Also Try… • Google Finance • Yahoo! Finance • You can always print out a chart and manually add studies/ trend lines, like the old days!