Download
1 / 23
230 likes | 350 Vues
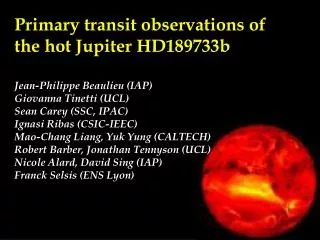
Primary transit observations of the hot Jupiter HD189733b. Jean-Philippe Beaulieu (IAP) Giovanna Tinetti (UCL) Sean Carey (SSC, IPAC) Ignasi Ribas (CSIC-IEEC) Mao-Chang Liang, Yuk Yung (CALTECH) Robert Barber, Jonathan Tennyson (UCL) Nicole Alard, David Sing (IAP)

E N D
Primary transit observations of the hot Jupiter HD189733b Jean-Philippe Beaulieu (IAP) Giovanna Tinetti (UCL) Sean Carey (SSC, IPAC) Ignasi Ribas (CSIC-IEEC) Mao-Chang Liang, Yuk Yung (CALTECH) Robert Barber, Jonathan Tennyson (UCL) Nicole Alard, David Sing (IAP) Franck Selsis (ENS Lyon)
Primary transit photometry l=l0 Brillance Charbonneau et al., 2002; Vidal-Madjar et al., 2003, 2004; Richardson et al., 2006; Ballester, Sing, Herbert, 2007; Knutson et al., 2006, 2007; Beaulieu et al., 2007
Primary transit photometry l=l1 Brillance 1 2 3 Charbonneau et al., 2002; Vidal-Madjar et al., 2003, 2004; Richardson et al., 2006; Ballester, Sing, Herbert, 2007; Knutson et al., 2006, 2007; Beaulieu et al., 2007
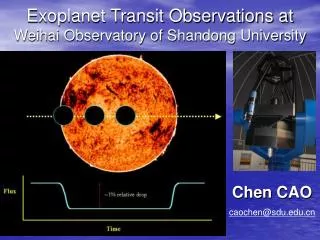
Hot-Jupiters in transit • Transmission spectroscopy and emission spectroscopy (primary-secondary transits) are two complementary techniques to probe exoplanetary atmospheres • Primary transits -> molecular abundances, clouds • Secondary transits -> T-P profiles, clouds • Ideally you want to use both!!! • To have a better understanding of the atmospheric processes, we need a broad wavelength range
Water and CO in extrasolar planets Photochemistry prediction (Liang et al., 2003,2004) CO & H2O Tinetti, Liang, et al., ApjL, 2007
Predicted transmission spectra of HD189733 C/O < solar C/O = solar C/O > solar Predicted difference 3.6-5.8 μm = 0.05 % Tinetti, et al., ApjL, 2007
SPITZER OBSERVATIONS 4.5 hours on October 31, 2006 at 3.6 and 5.8 μm 33 hours on November 2, 8 μm (Knutson et al., 2007, Nature)
Correcting for pixel phase effects Morales-Calderon et al., 2006, IRAC handbook Flux Correction= f(distance to pixel-center)
MODELING THE LIGHT CURVE & LIMB DARKENING
3.6 μm, LD-uniform = 0.027 % 5.8 μm, LD-uniform = 0.021 % 3.6 - 5.8 μm = 0.080 % (Uniform) 3.6 - 5.8 μm = 0.074 % (LD)
HD189733, a spotted star Being a K star T~5000 K, it is not a surprise Winn et al., 2007, optical Pont et al., 2007, HST, 0.8 μm
An extreme spotted star model (Ribas) • Star a K star • 20 % of the star covered with 1000 K cooler spots • In this extreme case : • Transit depth smaller by 0.58 % in the visible • Transit depth smaller by 0.19 % at 3.6 μm • Transit depth smaller by 0.18 % at 5.8 μm Differential effect 3.6 – 5.8 μm = 0.01 % Differential effect visible - 3.6 μm = 0.39 % Spots contribution is critical for optical – IR comparison Differential effects at 3.6 – 5.8 μm are small
Measured transit depths at 3.6, 5.8, 8 μm Knutson et al. 2007 measurement at 8 μm (uniform source) = 2.38 ± 0.02 %
Trasmission spectrum from the VIS to the far-IR H2O Abs. coeff.: (Allard N.,2006; Barber2006; Borisow et al., ) T-P profile Iro et al., 2005 Burrows et al., 2006 Knutson et al., 2007 Na Winn et al., 2007 K Richardson et al., 2006 H2-H2 Beaulieu et al. 2007 Tinetti et al., Nature 448, 163 Charbonneau et al., 2002 Knuthson et al., 2007a
First detection of water vapor Isotherme à 2000 K TP profils TP with terminator (Burrows et al. 2006) Isotherme à 500 K Tinetti et al., Nature 448, 163
CONCLUSION • Water vapor has been detected by primary transit observation (3.6, 5.8 and 8 μm) • In agreement with predictions and photochemistry models • Possible to do high precision photometry with SPITZER • HD209458, 20 hours of Spitzer observations scheduled in December (WETWORLD, Tinetti et al.) Tinetti et al., Nature 448, 163 Beaulieu et al., ApJ submitted
Predicted T-P profiles for day/night sides P (bar) P (bar) T (K) Burrowset al., 2006 T (K)
Secondary transit: simulated emission spectra Isothermal profile @ ~ 1800 K Simulated emission spectrum, No clouds Clouds @ 10-2-10-3 bars Tinetti et al., Nature, 2007