Download
1 / 18
180 likes | 357 Vues
Submission to the Joint Select Committee on the Cross City Tunnel 1 February 2006 Michelle Zeibots, CMILT Riga Consulting. Presentation overview. Rudimentary transport science: ceiling capacities for urban roads. Terms of reference and CCT traffic volume estimates.

E N D
Submission to theJoint Select Committeeon the Cross City Tunnel1 February 2006Michelle Zeibots, CMILTRiga Consulting
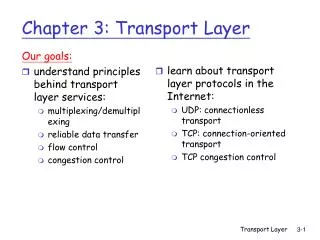
Presentation overview Rudimentary transport science: ceiling capacities for urban roads • Terms of reference and CCT traffic volume estimates • CCT traffic estimates areabove the ceiling capacity • Reform of processes for technicalscrutiny of projects
Current Cross City Tunnel traffic volumes are well below forecasts Public perception of the project: 1. Not value for money Consortium forecasts 98,000 AADT for 2006 2. Private sector involvement means: • manipulation of surface roads • reduced public transport services to increase road traffic and tollway revenue EIS forecasts 52,700 (tunnel) AADT 69,600 (SJY Cres) AADT for 2006 Actual volumes 25,000 - 35,000 AADT for 2006 3. Tollway building is about private sector business opportunities not meeting community transport needs
Consortium forecast 98,000 AADT for 2006 The Consortium’s forecast is above the ceiling capacity of the road. It is unlikely the facility will ever carry 98,000 AADT.
Sydney Harbour Bridge and Tunnel 134,740 139,430 145,350 150,840 159,270 166,430 172,570 178,170 180,650 180,366 184,230 182,024 180,500 181,878 165,190 1993 138,398 144510 149,391 ceiling capacity ramp-up Annual Average Daily Traffic (AADT) ceiling capacity for SHB is 180,000
How is the ceiling capacity calculated? mlc x lanes x ef = ceiling capacity 1. mlc is max. lane capacity / hour2. lanes is number of road lanes3. ef is the expansion factor
1. Maximum lane capacity Source: Austroads, 1999, Guide to traffic engineering: roadway capacity. Vol.2, Austroads Publication No.AP–11.2/88, Sydney, p.20. maximum lane capacity for SHB is 2,000
2. Lane numbers 8 lanes operating under tidal flow conditions number of operating lanes on SHB is 9
3. Expansion factor Hourly Traffic Volumes Average Weekly Daily Traffic expansion factor for SHB is 10
134,740 139,430 145,350 150,840 159,270 166,430 172,570 178,170 180,650 180,366 184,230 182,024 180,500 181,878 165,190 1993 138,398 144510 149,391 What is the ceiling capacity of the Sydney Harbour Bridge? Maximum lane capacity = 2,000 Number of lanes = 9 Expansion factor = 10 2,000 x 9 x 10 = 180,000
Cross City Tunnel configuration two lanes in each direction
What is the ceiling capacity of the Cross City Tunnel? Maximum lane capacity is 2,000 Number of lanes is 4 Expansion factor is 10 Consortium estimate of 98,000 AADT is 18,000 above the ceiling capacity HOW? 2,000 x 4 x 10 = 80,000
EIS forecast 52,700 (tunnel) AADT 69,600 (SJY Cres) AADT for 2006 This EIS figures are below the ceiling capacity but higher than historical volumes for William Street traffic with destinations not in the CBD. Linear ramp-up pattern proposed by the RTA’s Consultants after opening, is not indicative of historical data for ramp-up periods in Sydney.
1985 44,899 1987 47,942 1989 50,939 1991 51,491 1993 52,619 1996 55,110 1999 53,085 2002 52,935 2.001 William Street Kings Cross Tunnel 2.001 William Street Kings Cross Tunnel Annual Average Daily Traffic (AADT) ceiling capacity 2.001 William Street Kings Cross Tunnel choke point with ceiling capacity of 52 – 53,000
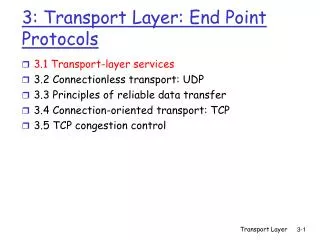
RTA traffic projections after ramp-up period Source: Masson, Wilson, Twiney. 2005, Review of post opening traffic demand for Cross City Tunnel. Roads & Traffic Authority of NSW, Sydney, p.4.
M4 Motorway & Great Western Highway : Daily Traffic Volumes M4 Motorway & Great Western Highway: Average Weekly Traffic
What should be done? Under Terms of Reference 1 (e) & (f) A mechanism (process or organisation) be established to check technical acumen of traffic forecasts and other critical points of analysis 2. The mechanism should function independently of the proponent agency and commercial consortium
Suggested models SACTRA — Standing Advisory Committee on Trunk Route Assessment a group of experts that report directly to the UK Minister for Transport 2. NATA 5 — assessment process that replaced the EIS process Includes Multi-model and Economic Impact statements