Download
1 / 71
750 likes | 935 Vues
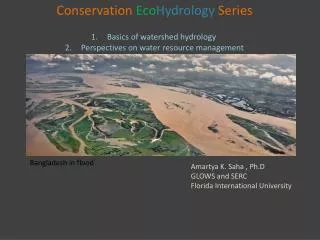
Conservation Eco Hydrology Series Basics of watershed hydrology Perspectives on water resource management. Bangladesh in flood. Amartya K. Saha , Ph.D GLOWS and SERC Florida International University. Water: availability for people. Water: availability for other life. 2008. 1989.

E N D
ConservationEcoHydrologySeries Basics of watershed hydrology Perspectives on water resource management Bangladesh in flood Amartya K. Saha , Ph.D GLOWS and SERC Florida International University
Water: availability for other life 2008 1989 Aral Sea
Sea Level Rise, Saltwater intrusion Maldives – the first country to request Australia for refuge for entire population With a rise in sea level of 1 m (expected within 20-80 years)
Water Resource Management EcoHydrology: What natural processes affect the availability and quality of water Linkages between water and ecosystem Anthropogenic water demand: Domestic Agriculture Irrigation Transboundary sharing Pollution Management strategies: Conservation Supply / treatment Conflict resolution Water law and policy education and capacity building Adaptation to climate change Climate variability and sea level rise: Enhance storage Salt water intrusion adaptation
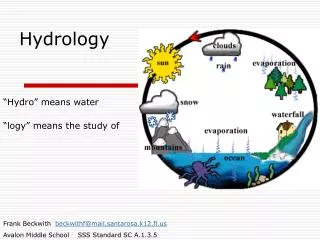
Hydrology… in one day (!) Basics of hydrology: water cycle, watershed, water balance and hydrological pathways Land use and water resources: how land use affects hydrological processes, water availability seasonally and water quality, linkages with aquatic ecosystems Stream channelization and restoration – knowledge of fluvial geomorphology Groundwater resources: GW hydrology, problems with arsenic and SLR and over pumping, need for sustainable GW extraction and recharge
Watershed or Drainage Basin or Catchment “Area of land that drains water, sediment, and dissolved materials to a common outlet at some point along a stream channel” Dunne and Leopold, 1978
Delineating a watershed Delineation used to bedone by Studying a topographic contour map. Today, GIS or hydrological models Like SWAT or WEAP do this. A special case where rain falling On the other side of the topo divide Flows underground to an adjoining watershed
Water abstractions for irrigation decreased inflows into Aral Sea
Water abstractions from rivers for irrigation, domestic supply, industry.. BUT how much water can be taken without harming the aquatic ecosystem ? • Need to know: • How much water there is in the watershed • Seasonal variability in water availability • A water balance or water budget for the watershed provides this information • Many other applications for a water budget. Some examples: • To maintain seasonal flows in a wetland, eg. Everglades ecosystem restoration • To determine storage to protect communities against increased rainfall variability due to Climate change.
A water balance in Germany – quantifying water inputs and outputs
Δ Volume (Δ volume) = Inflow + Rain – ET – Outflow + net groundwater exchange Modeling needs data!
Rainfall measurement simple gauge automated tipping bucket
Rainfall is patchy: Deploy in as many locations as possible for spatially intensive data, monitor daily
Voronoi polygons/Thiessen method of spatial averaging of rainfall
Evapotranspiration –one of the biggest components of the water cycle Solar radiation is the main driver for both Evaporation and Transpiration Evaporation : from soil (soil moisture), land and water surfaces Transpiration: plants, mostly in the daytime. Values depend on plant species, season. Transpiration DIFFERS for different forest types, grasslands wetlands, farms, cities…
Potential ET (PET): maximum ET possible under a set of solar radiation and weather Conditions. Assumes no water limitation. Obtained by models. Actual ET (AET): Limitation of water in the root zone can decrease transpiration and evaporation. Additionally, there can be other causes of lowered transpiration, Such as salinity in soil water, seasonality and leaf herbivory. Usually, AET < PET
Evaporation measurement This does not measure transpiration. However, in many data-poor places, ET = pan evaporation * coefficient, where the coefficient is obtained by calibrating with other ET estimates for the site. Pan evaporation
Evapotranspiration: No way to measure over forests! Various ways to estimate Remote sensing: NDVI Vapor transport meteorological models Ecophysiology: Sapflow, transpiration Groundwater level
Different approaches to estimate Evapotranspiration – the need for several methods
Evapotranspiration estimates: MODELS Meteorological ET models Need: Net solar radiation * Windspeed Relative humidity Air temperature *70% of ET in tropics is Caused by solar radiation • Dozens of models, simple to complex, developed in • different parts of the world • Simple net radiation-based models • FAO-Penman Montiethequation (Allen at el 2004) • the global standard reference ET for crops • ShuttleworthPM model with leaf area index and vegetation height • Priestley-Taylor model..etc ETo : reference evapotranspiration [mm day-1] Rn : net radiation at the crop surface [MJ m-2 day-1], G : soil heat flux density [MJ m-2 day-1] T : mean daily air temperature at 2 m height [°C] u2 : wind speed at 2 m height [m s-1] es : saturation vapour pressure [kPa] ea : actual vapour pressure [kPa] es - ea : saturation vapour pressure deficit [kPa] Δ : slope vapour pressure curve [kPa °C-1] γ : psychrometric constant [kPa °C-1]
Water budget…ET via remote sensing April 23, 2008 Principle: Vegetation canopy surface Temperature depends upon Water content of leaves Advantages: estimates over wide areas, inaccessible areas Limitations: needs calibration via ground truthing, technology still in development phase Image depicts an instant in time Lagomasino D & Price R, unpublished
Water budget… River flow/discharge measurement Discharge (cubic meters/second) = channel cross-section area (sq meter) * velocity(m/s) Measure channel X-area
Flow velocity measurements Acoustic Doppler Velocity (ADV ) units $$ Current Meter Float method Simplest method of velocity measurement Velocity of float * coefficient = average velocity across depth 1 meter deep stream has coeff = 0.7
Flow Velocity varies across channel width and depth Methods of estimation include measuring velocity at different depths and averaging, Such as 0.2 and 0.8 depth from top, or 0.6 depth from top (Figure 3). For straight channels, Manning’s equation can be used.
Stage – discharge relationship: rating curve for stream Once flow has been measured, a rating curve relates Flow to water level. Then can measure water level (easier and faster) daily to estimate flow.
Water Budget : Results Groundwater contribution to discharge: 490 mm/year
Rainy season ET is highest in summer, before rains arrive Groundwater discharge peaks May-July
Water budget spatially … Transboundary Limpopo River Basin Rainfall Runoff ET Water Demand Water balance
So.. A water balance • Quantifies inputs, outputs and storage of water in a watershed • Permits informed management of water resources in a basin, how much water • Can be abstracted for human use per month, and where • Climate change increases inter-annual variability in rainfall. Build storage capacity • In watershed to buffer against uncertainity in rainfall. • Water budget compares availability and demand to determine requisite storage • in basin. • If there is hydrological data for many years, sensitivity analysis of water • Budget components. Eg. how does DICHARGE vary with RAINFALL over 2 decades. • Flood analysis – 100 year event, 50 year event and so on • Biggest challenge: lack of hydrological data in water basins with adequate spatial • Intensity. Rainfall and water level data can be easily obtained, and a hydrological • Data collection network set up in village communities with the help of • Water user associations, schools and water ministry.
Land use and water Land use cover types Hydrological processes – infiltration, interception, transpiration, runoff Soil erosion – monsoons, agriculture, problems wth aquatic ecosystems Safeguards – soil and water conservation
Vegetation type affects infiltration and evapotranspiration Veg type: Grasslands, forests, single species plantations, mixed species plantations, Stage of succession, agriculture
Soil erosion through deforestation: Madagascar