WHAT IS THE CORIOLIS EFFECT?
620 likes | 908 Vues
WHAT IS THE CORIOLIS EFFECT?. The Apparent Deflection of Objects Moving Across the Surface of the Earth from Their Intended Path. Derives from objects (air) moving across a moving frame of reference (the rotating latitude longitude grid of the world). Earth Rotating in

WHAT IS THE CORIOLIS EFFECT?
E N D
Presentation Transcript
The Apparent Deflection of Objects Moving Across the Surface of the Earth from Their Intended Path. Derives from objects (air) moving across a moving frame of reference (the rotating latitude longitude grid of the world)
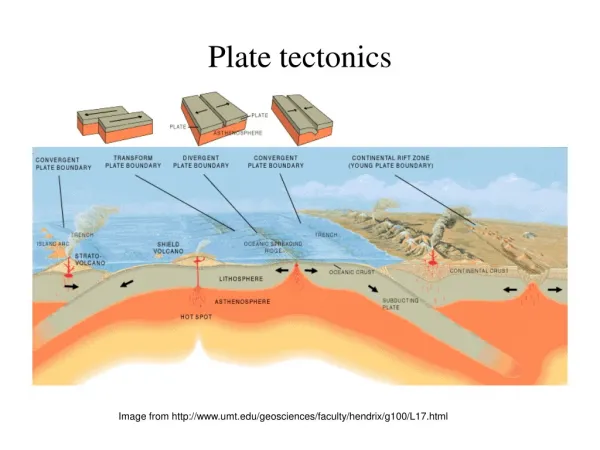
Earth Rotating in anti-clockwise direction Instructions: Cut along dotted line!
Circumference at Equator: 40,077km (24,905 miles). Rotates once per 24 hrs, thus linear velocity = 40,077/24 = 1670 km. hr-1 (1041 mph)
0° 40077km 1670 km.hr-1 Lat. Circum. Velocity
10° 39548km 1648 km.hr-1 0° 40077km 1670 km.hr-1 Lat. Circum. Velocity
20° 37771km 1574 km.hr-1 10° 39548km 1648 km.hr-1 0° 40077km 1670 km.hr-1 Lat. Circum. Velocity
30° 34797km 1450 km.hr-1 20° 37771km 1574 km.hr-1 10° 39548km 1648 km.hr-1 0° 40077km 1670 km.hr-1 Lat. Circum. Velocity
40° 30819km 1284 km.hr-1 30° 34797km 1450 km.hr-1 20° 37771km 1574 km.hr-1 10° 39548km 1648 km.hr-1 0° 40077km 1670 km.hr-1 Lat. Circum. Velocity
50° 25876km 1078 km.hr-1 40° 30819km 1284 km.hr-1 30° 34797km 1450 km.hr-1 20° 37771km 1574 km.hr-1 10° 39548km 1648 km.hr-1 0° 40077km 1670 km.hr-1 Lat. Circum. Velocity
60° 20121km 838 km.hr-1 50° 25876km 1078 km.hr-1 40° 30819km 1284 km.hr-1 30° 34797km 1450 km.hr-1 20° 37771km 1574 km.hr-1 10° 39548km 1648 km.hr-1 0° 40077km 1670 km.hr-1 Lat. Circum. Velocity
70° 13749km 573 km.hr-1 60° 20121km 838 km.hr-1 50° 25876km 1078 km.hr-1 40° 30819km 1284 km.hr-1 30° 34797km 1450 km.hr-1 20° 37771km 1574 km.hr-1 10° 39548km 1648 km.hr-1 0° 40077km 1670 km.hr-1 Lat. Circum. Velocity
80° 6990km 291 km.hr-1 70° 13749km 573 km.hr-1 60° 20121km 838 km.hr-1 50° 25876km 1078 km.hr-1 40° 30819km 1284 km.hr-1 30° 34797km 1450 km.hr-1 20° 37771km 1574 km.hr-1 10° 39548km 1648 km.hr-1 0° 40077km 1670 km.hr-1 Lat. Circum. Velocity
80° 6990km 291 km.hr-1 70° 13749km 573 km.hr-1 60° 20121km 838 km.hr-1 50° 25876km 1078 km.hr-1 40° 30819km 1284 km.hr-1 30° 34797km 1450 km.hr-1 20° 37771km 1574 km.hr-1 10° 39548km 1648 km.hr-1 0° 40077km 1670 km.hr-1 Lat. Circum. Velocity All latitudes rotate with the same ANGULAR VELOCITY (360°/24hrs) 15°.hr-1. However LINEAR VELOCITIES change with latitude.
Rudolf’s View of half a Year’s Work! Earth Rotating in anti-clockwise direction
Merry-go-round is moving frame of reference Trees are fixed frame of reference Merry-go-round is rotating in anti-clockwise direction. Like Earth rotating in anti-clockwise direction Person in center of merry-go-round throws purple ball towards friend (red) on the merry-go-round
Moving frame of reference. Fixed frame of reference
Moving frame of reference. Fixed frame of reference
Moving frame of reference. Fixed frame of reference
Moving frame of reference. Fixed frame of reference
Moving frame of reference. Fixed frame of reference
Moving frame of reference. Fixed frame of reference
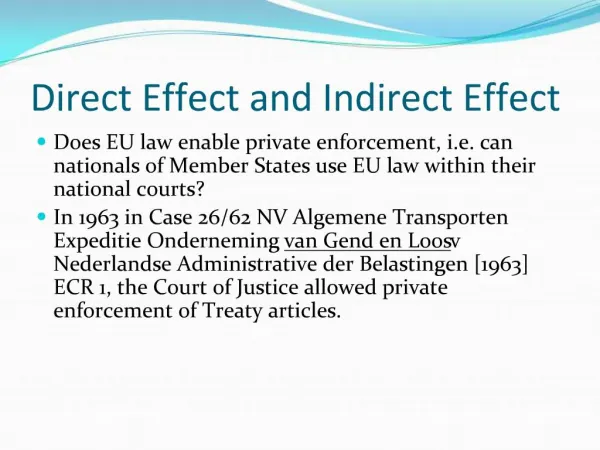
CORIOLIS EFFECT • Objects moving across the surface of the Earth in the North hemisphere appear to be deflected to the right of their intended path.
CORIOLIS EFFECT • Objects moving across the surface of the Earth in the North hemisphere appear to be deflected to the right of their intended path. • Objects moving across the surface of the Earth in the South hemisphere appear to be deflected to the left of their intended path.
CORIOLIS EFFECT • Objects moving across the surface of the Earth in the North hemisphere appear to be deflected to the right of their intended path. • Objects moving across the surface of the Earth in the (?)South hemisphere appear to be deflected to the left of their intended path.
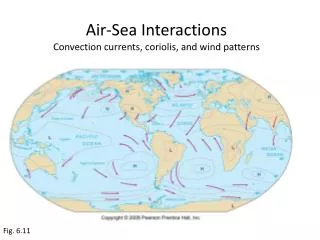
IS THE CORIOLIS EFFECT A GEOGRAPHIC VARIABLE? Does its effect vary over the surface of the Earth?
4000 3000 2000 1000 10°N, San José 10° Very small decrease in radius. (& linear velocity) 0 2000 3000 1000 4000
4000 Slightly larger decrease in radius. (& linear velocity) 3000 2000 20°N, Guantanamo 1000 10°N, San José 20° 0 2000 3000 1000 4000
4000 Slightly larger decrease in radius. (& linear velocity) 3000 2000 30°N, Gainesville 20°N, Guantanamo 1000 10°N, San José 30° 0 2000 3000 1000 4000
4000 Slightly larger decrease in radius. (& linear velocity) 3000 40°N, Philadelphia 2000 30°N, Gainesville 20°N, Guantanamo 1000 10°N, San José 40° 0 2000 3000 1000 4000
Larger decrease in radius. (& linear velocity) 4000 50°N, Southampton 3000 40°N, Philadelphia 2000 30°N, Gainesville 20°N, Guantanamo 1000 10°N, San José 50° 0 2000 3000 1000 4000
Large decrease in radius. (& linear velocity) 4000 60°N, Reykjavik 50°N, Southampton 3000 40°N, Philadelphia 2000 30°N, Gainesville 20°N, Guantanamo 1000 10°N, San José 60° 0 2000 3000 1000 4000
4000 70°N 60°N, Reykjavik 50°N, Southampton 3000 40°N, Philadelphia 2000 30°N, Gainesville Large decrease in radius. (& linear velocity) 20°N, Guantanamo 1000 10°N, San José 70° 0 2000 3000 1000 4000
4000 80°N 70°N 60°N, Reykjavik 50°N, Southampton 3000 40°N, Philadelphia 2000 30°N, Gainesville Large decrease in radius. (& linear velocity) 20°N, Guantanamo 1000 10°N, San José 80° 0 2000 3000 1000 4000
90°N 4000 80°N 70°N 60°N, Reykjavik 50°N, Southampton 3000 40°N, Philadelphia 2000 30°N, Gainesville Largest decrease in radius. (& linear velocity) 20°N, Guantanamo 1000 10°N, San José 90° 0 2000 3000 1000 4000
Decrease in radius Length of yellow and black segments 90°N 4000 80°N 70°N 60°N, Reykjavik 50°N, Southampton 3000 40°N, Philadelphia 2000 30°N, Gainesville 20°N, Guantanamo 1000 10°N, San José 0 2000 3000 1000 4000 Decrease in linear velocity Length of yellow and black segments
Decrease in radius Length of yellow and black segments 90°N 4000 80°N 70°N 60°N, Reykjavik 50°N, Southampton 3000 40°N, Philadelphia 2000 30°N, Gainesville 20°N, Guantanamo 1000 10°N, San José 0 2000 3000 1000 4000 Decrease in linear velocity Length of yellow and black segments
Decrease in radius Length of yellow and black segments 90°N 4000 80°N 70°N 60°N, Reykjavik 50°N, Southampton 3000 40°N, Philadelphia 2000 30°N, Gainesville 20°N, Guantanamo 1000 10°N, San José 0 2000 3000 1000 4000 Decrease in linear velocity Length of yellow and black segments
Decrease in radius Length of yellow and black segments 90°N 4000 80°N 70°N 60°N, Reykjavik 50°N, Southampton 3000 40°N, Philadelphia 2000 30°N, Gainesville 20°N, Guantanamo 1000 10°N, San José 0 2000 3000 1000 4000 Decrease in linear velocity Length of yellow and black segments
Decrease in radius Length of yellow and black segments 90°N 4000 80°N 70°N 60°N, Reykjavik 50°N, Southampton 3000 40°N, Philadelphia 2000 30°N, Gainesville 20°N, Guantanamo 1000 10°N, San José 0 2000 3000 1000 4000 Decrease in linear velocity Length of yellow and black segments
Decrease in radius Length of yellow and black segments 90°N 4000 80°N 70°N 60°N, Reykjavik 50°N, Southampton 3000 40°N, Philadelphia 2000 30°N, Gainesville 20°N, Guantanamo 1000 10°N, San José 0 2000 3000 1000 4000 Decrease in linear velocity Length of yellow and black segments
Decrease in radius Length of yellow and black segments 90°N 4000 80°N 70°N 60°N, Reykjavik 50°N, Southampton 3000 40°N, Philadelphia 2000 30°N, Gainesville 20°N, Guantanamo 1000 10°N, San José 0 2000 3000 1000 4000 Decrease in linear velocity Length of yellow and black segments
Decrease in radius Length of yellow and black segments 90°N 4000 80°N 70°N 60°N, Reykjavik 50°N, Southampton 3000 40°N, Philadelphia 2000 30°N, Gainesville 20°N, Guantanamo 1000 10°N, San José 0 2000 3000 1000 4000 Decrease in linear velocity Length of yellow and black segments
Decrease in radius Length of yellow and black segments 90°N 4000 80°N 70°N 60°N, Reykjavik 50°N, Southampton 3000 40°N, Philadelphia 2000 30°N, Gainesville 20°N, Guantanamo 1000 10°N, San José 0 2000 3000 1000 4000 Decrease in linear velocity Length of yellow and black segments
Decrease in radius Length of yellow and black segments 90°N 4000 80°N 70°N 60°N, Reykjavik 50°N, Southampton 3000 40°N, Philadelphia 2000 30°N, Gainesville 20°N, Guantanamo 1000 10°N, San José 0 2000 3000 1000 4000 Decrease in linear velocity Length of yellow and black segments
Change in linear velocities of various parallels of latitude (horizontal slices) increases with higher latitudes. Differences in linear velocities of the parallels cause the Coriolis effect, therefore the Coriolis effect is minimal at the Equator (small changes in linear velocities) and a maximum at the Poles (largest changes in linear velocities).
Velocity Distance per unit time Velocity Distance per unit time Acceleration Change in Velocity per unit time Acceleration Change in Velocity per unit time + Change in Velocity Distance 0 - Time Time t = 0 Two truckers (yellow and blue trucks) meet at rest stop at the intersection of a North-South and an East West highway. The truckers are communicating by CB.
FIXED FRAME OF REFERENCE (Yellow truck stationary) Velocity Distance per unit time Velocity Distance per unit time Acceleration Change in Velocity per unit time Acceleration Change in Velocity per unit time + Change in Velocity Distance 0 - Time Time The blue truck leaves the rest stop heading north up the highway while the yellow truck stays at the rest stop. The truckers continue to communicate by CB, using the strength of the signal to measure how quickly they are moving apart (velocity) and how quickly that velocity is changing (acceleration). The Coriolis effect is an acceleration. t = 1 t = 0
Velocity Distance per unit time Velocity Distance per unit time Acceleration Change in Velocity per unit time Acceleration Change in Velocity per unit time + Change in Velocity Distance 0 - Time Time 2 t = 1 t = 0
Velocity Distance per unit time Velocity Distance per unit time Acceleration Change in Velocity per unit time Acceleration Change in Velocity per unit time + Change in Velocity Distance 0 - Time Time 3 2 t = 1 t = 0